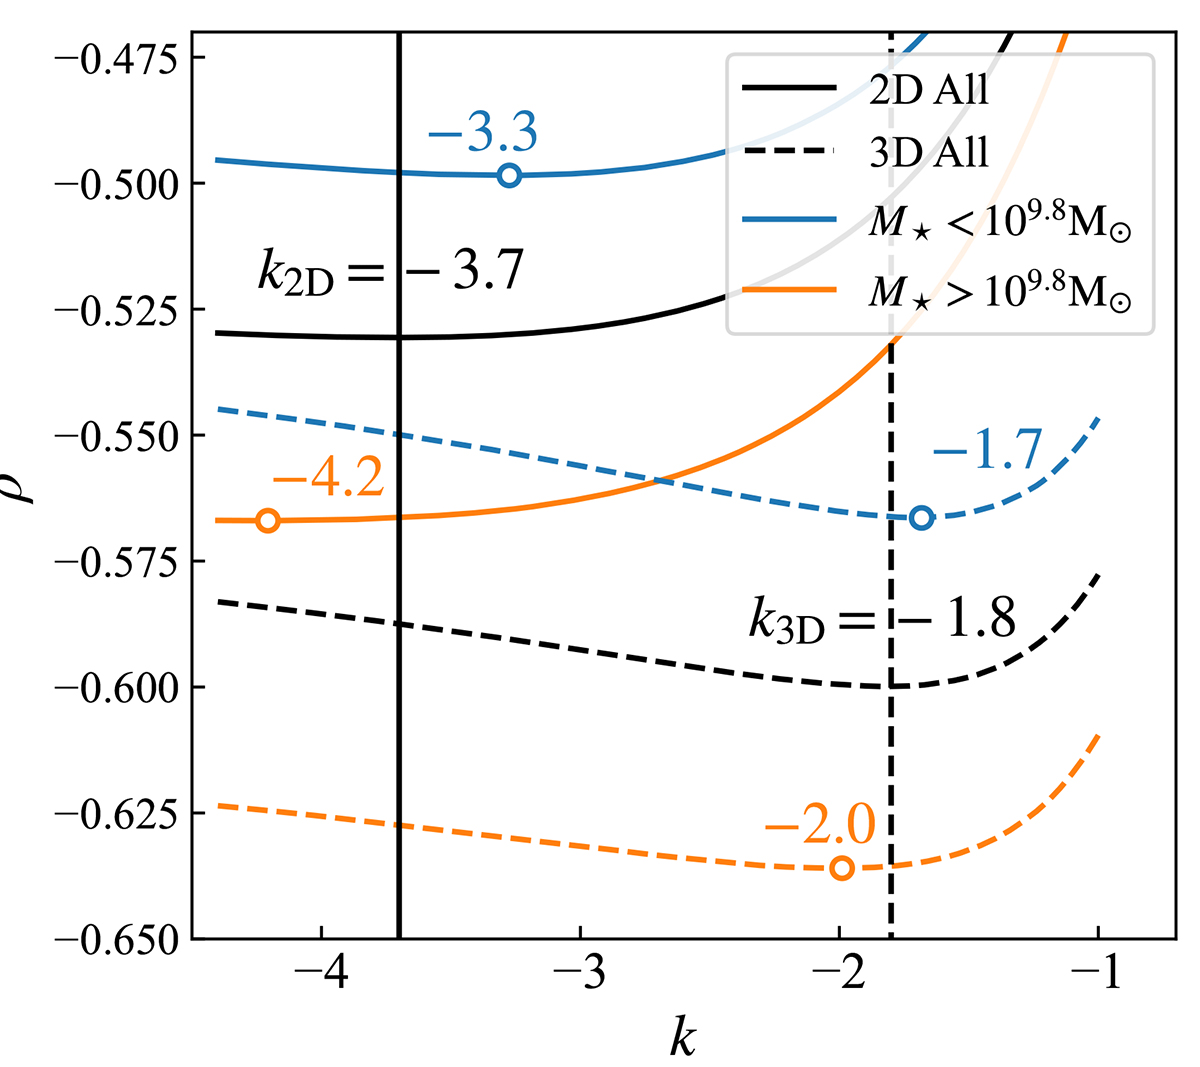
Fig. 4.
Download original image
Spearman coefficients, ρ, between the infall time, tfall, and the linear distance, dlinear, as functions of the slope, k. Solid and dashed curves show results in the R − V diagram and phase space, respectively. Black curves represent the full galaxy sample, with vertical lines marking the optimal k where ρ reaches minima. Blue and orange curves represent the low-mass and high-mass galaxies, respectively, with corresponding minima indicated by open circles.
Current usage metrics show cumulative count of Article Views (full-text article views including HTML views, PDF and ePub downloads, according to the available data) and Abstracts Views on Vision4Press platform.
Data correspond to usage on the plateform after 2015. The current usage metrics is available 48-96 hours after online publication and is updated daily on week days.
Initial download of the metrics may take a while.