Open Access
Fig. 2.
Download original image
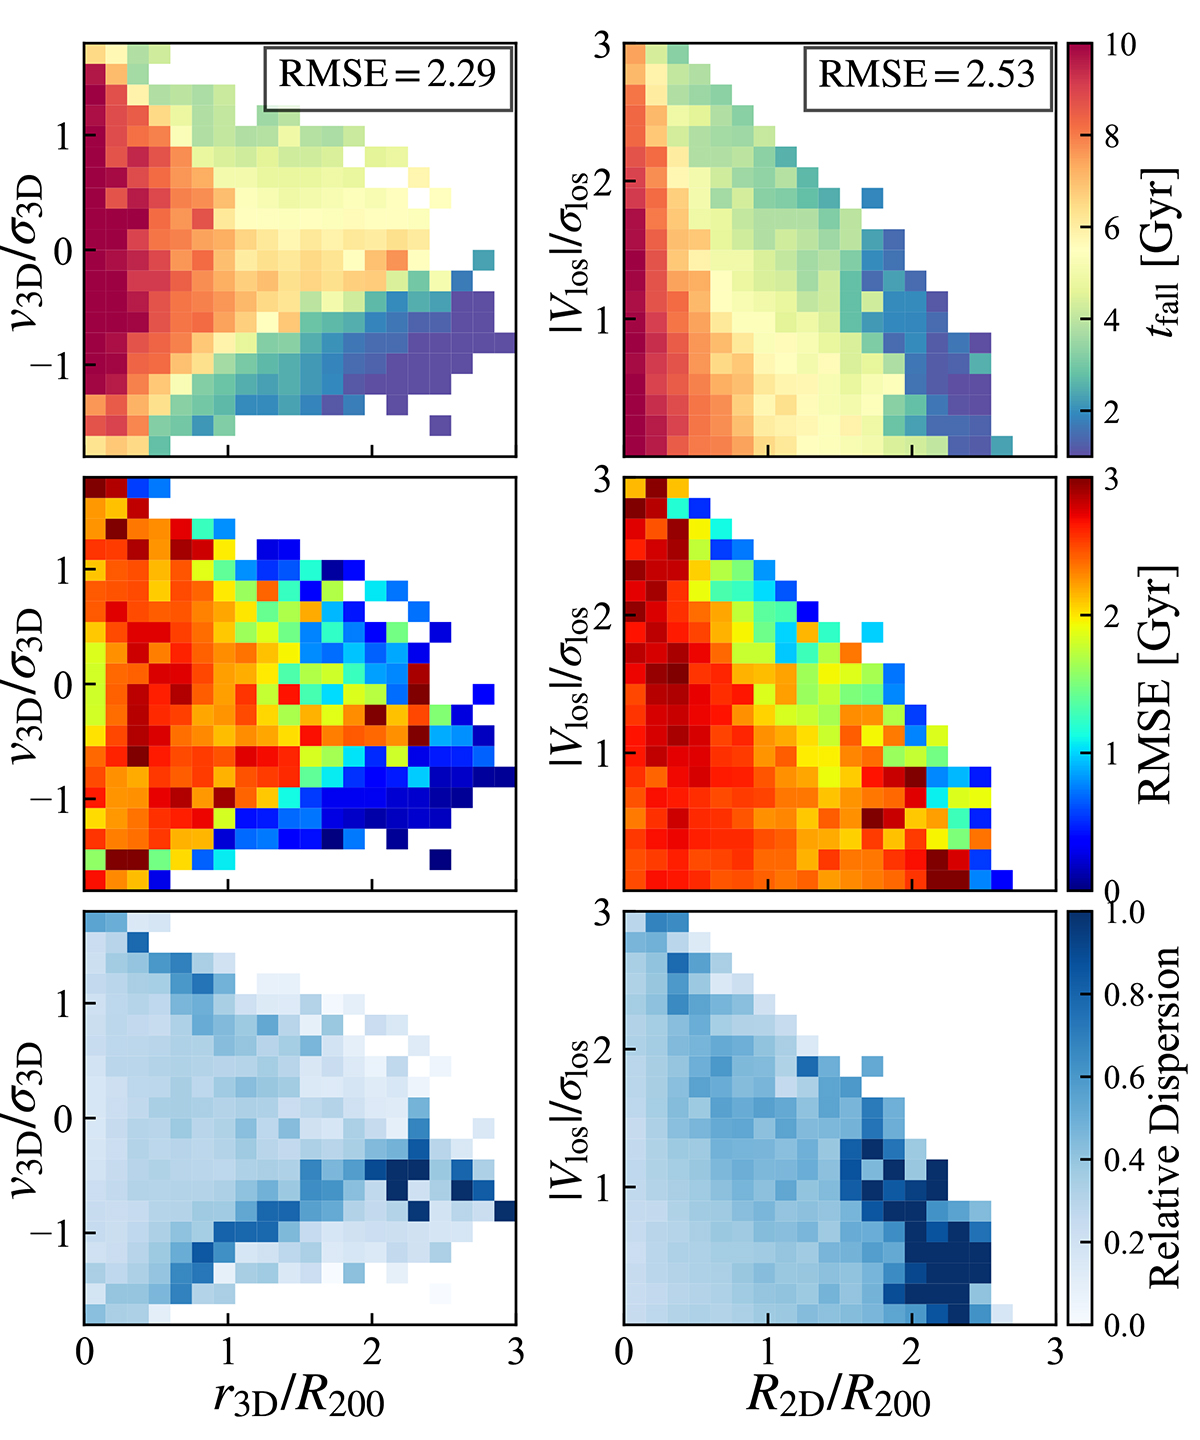
Top: Median tfall distributions in the phase space (left) and the R − V diagram (right). Middle: Dispersion distributions, defined as RMSE relative to the median in each pixel. Bottom: Relative dispersion distribution, defined as the ratio of RMSEpix to the median tfall.
Current usage metrics show cumulative count of Article Views (full-text article views including HTML views, PDF and ePub downloads, according to the available data) and Abstracts Views on Vision4Press platform.
Data correspond to usage on the plateform after 2015. The current usage metrics is available 48-96 hours after online publication and is updated daily on week days.
Initial download of the metrics may take a while.