Fig. 11.
Download original image
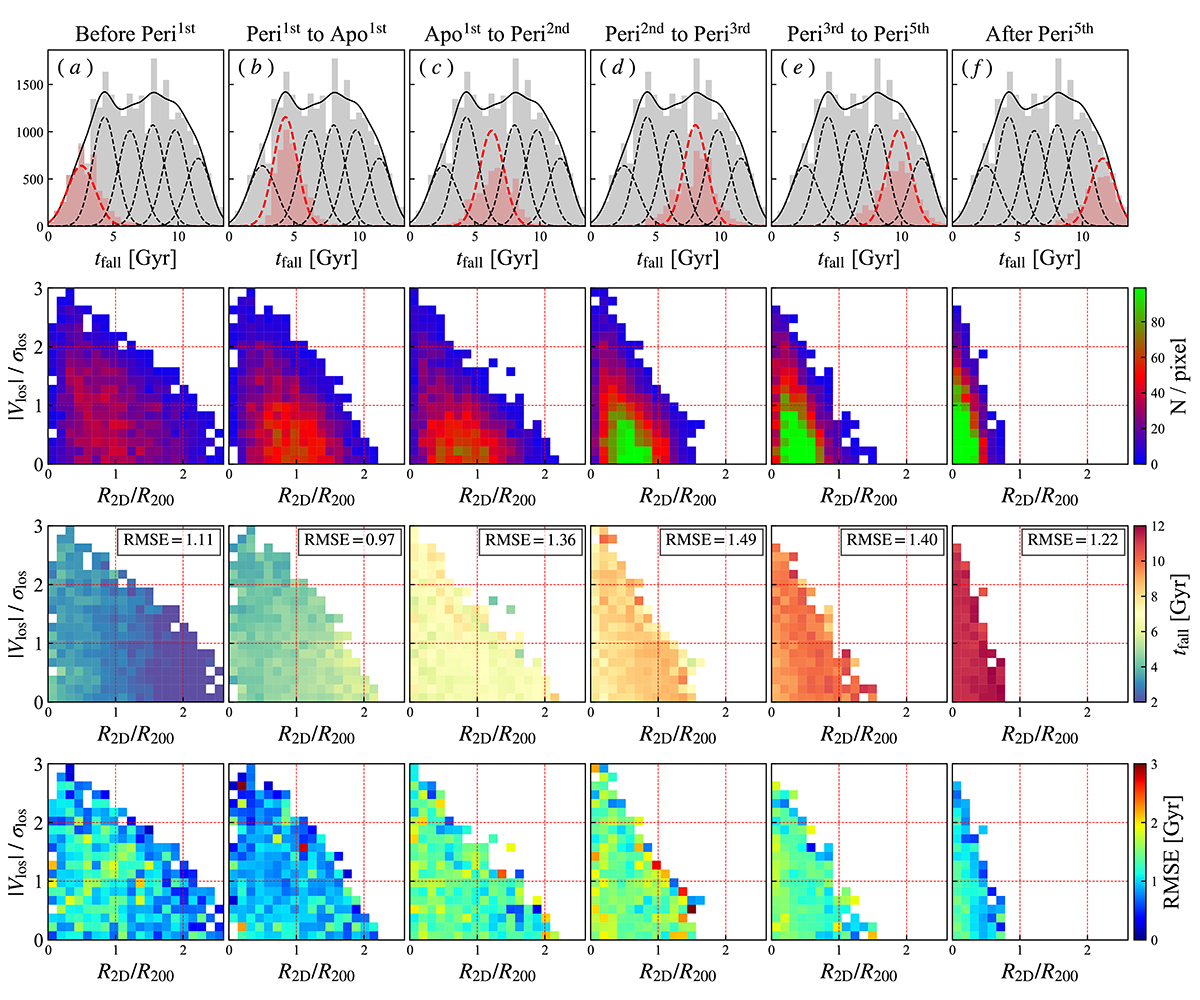
Top panels: Infall time distributions. The grey histograms represent all the galaxies, and the dashed and solid curves represent the results of GMM fitting, which yields six Gaussian components. The tfall distributions of the six orbital populations are shown as red histograms. These curves roughly align with the six Gaussian components, which are highlighted as red dashed curves one by one for visual clarity. Rows 2 to 4: Number distributions, median tfall distributions, and RMSEpix distributions in the R − V diagram of the six orbital populations.
Current usage metrics show cumulative count of Article Views (full-text article views including HTML views, PDF and ePub downloads, according to the available data) and Abstracts Views on Vision4Press platform.
Data correspond to usage on the plateform after 2015. The current usage metrics is available 48-96 hours after online publication and is updated daily on week days.
Initial download of the metrics may take a while.