Fig. 10.
Download original image
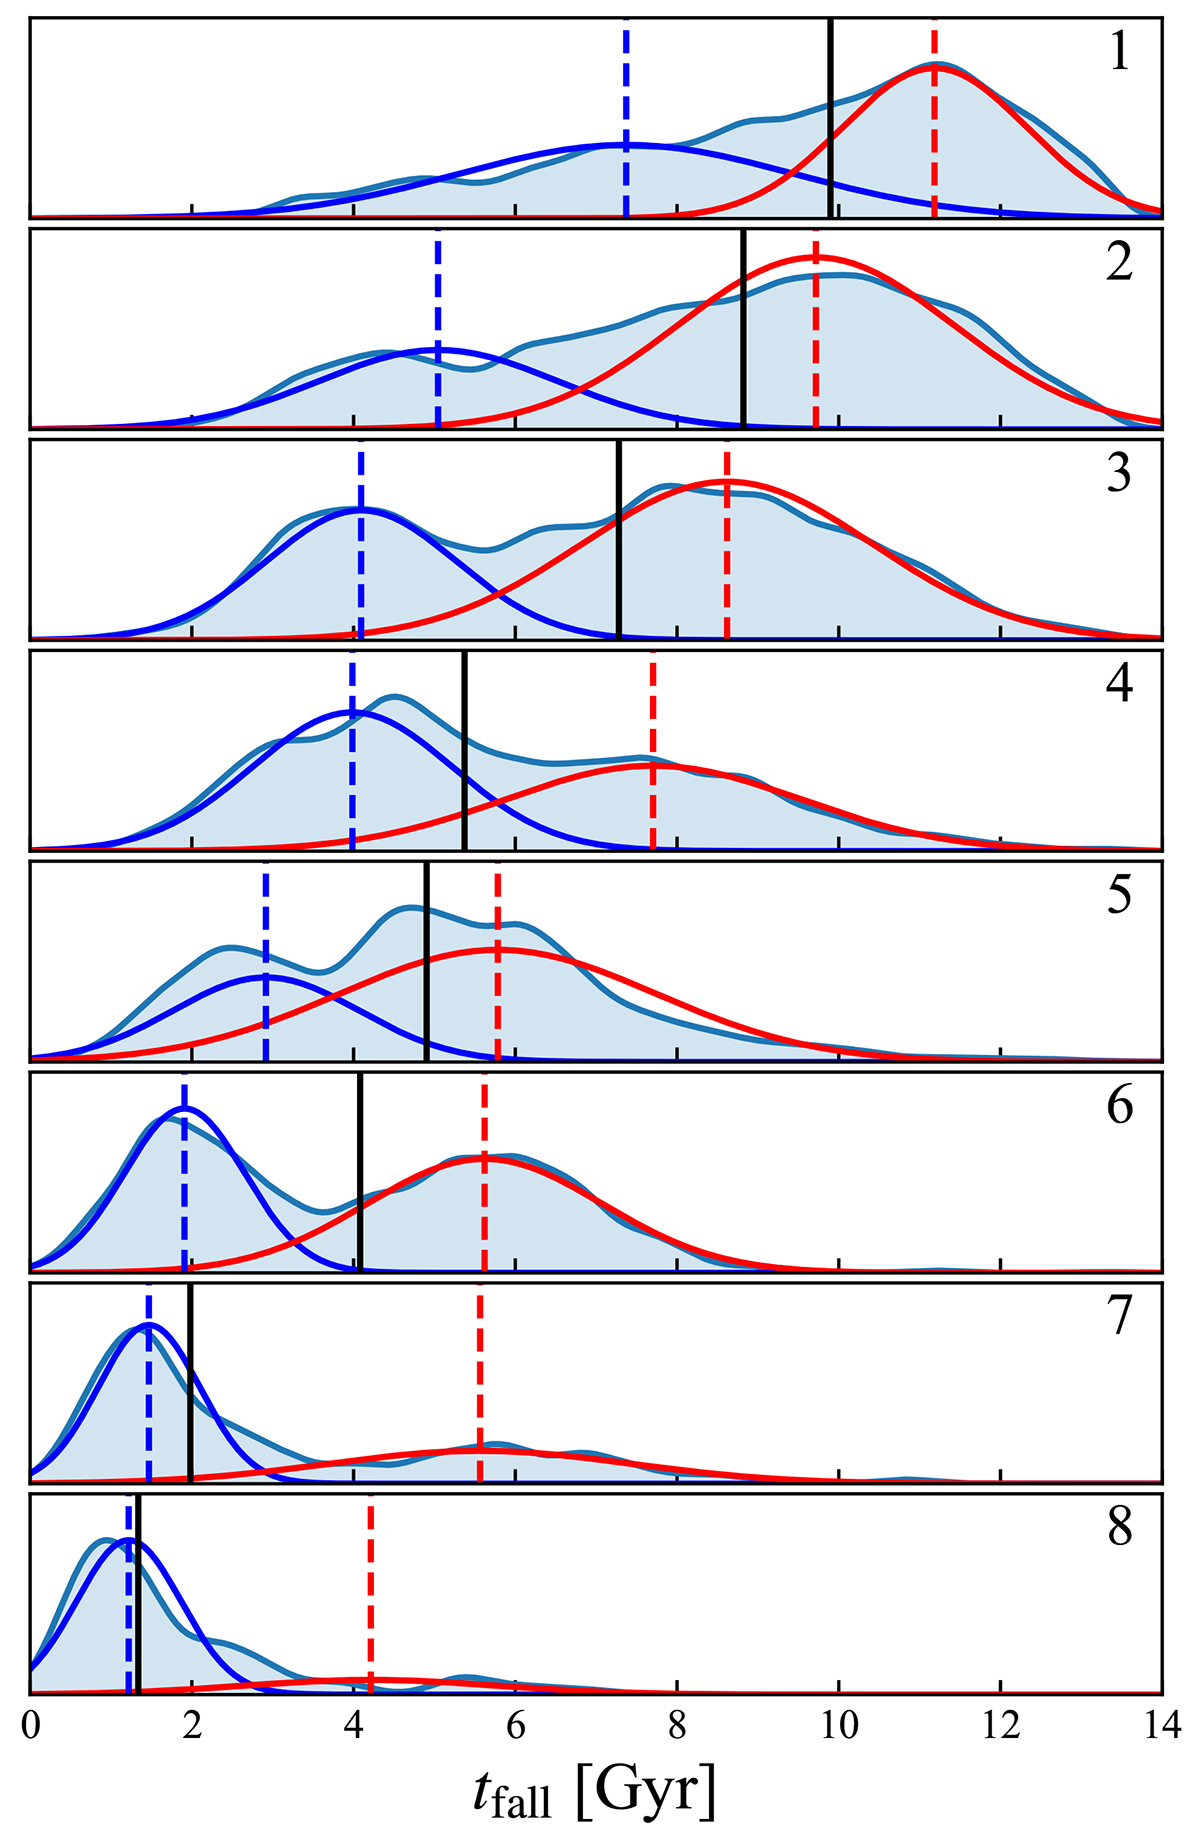
Infall time distributions in the eight zones of the linear partition method. The zone numbers are indicated in the upper right corners. The blue shadings represent the tfall distributions constructed via Gaussian kernel density estimation with a kernel size of 0.3 Gyr. The black vertical lines indicate the median tfall in each zone. The blue and red curves are the two components obtained through the GMM, with the blue and red dashed lines indicating their peak locations.
Current usage metrics show cumulative count of Article Views (full-text article views including HTML views, PDF and ePub downloads, according to the available data) and Abstracts Views on Vision4Press platform.
Data correspond to usage on the plateform after 2015. The current usage metrics is available 48-96 hours after online publication and is updated daily on week days.
Initial download of the metrics may take a while.