Open Access
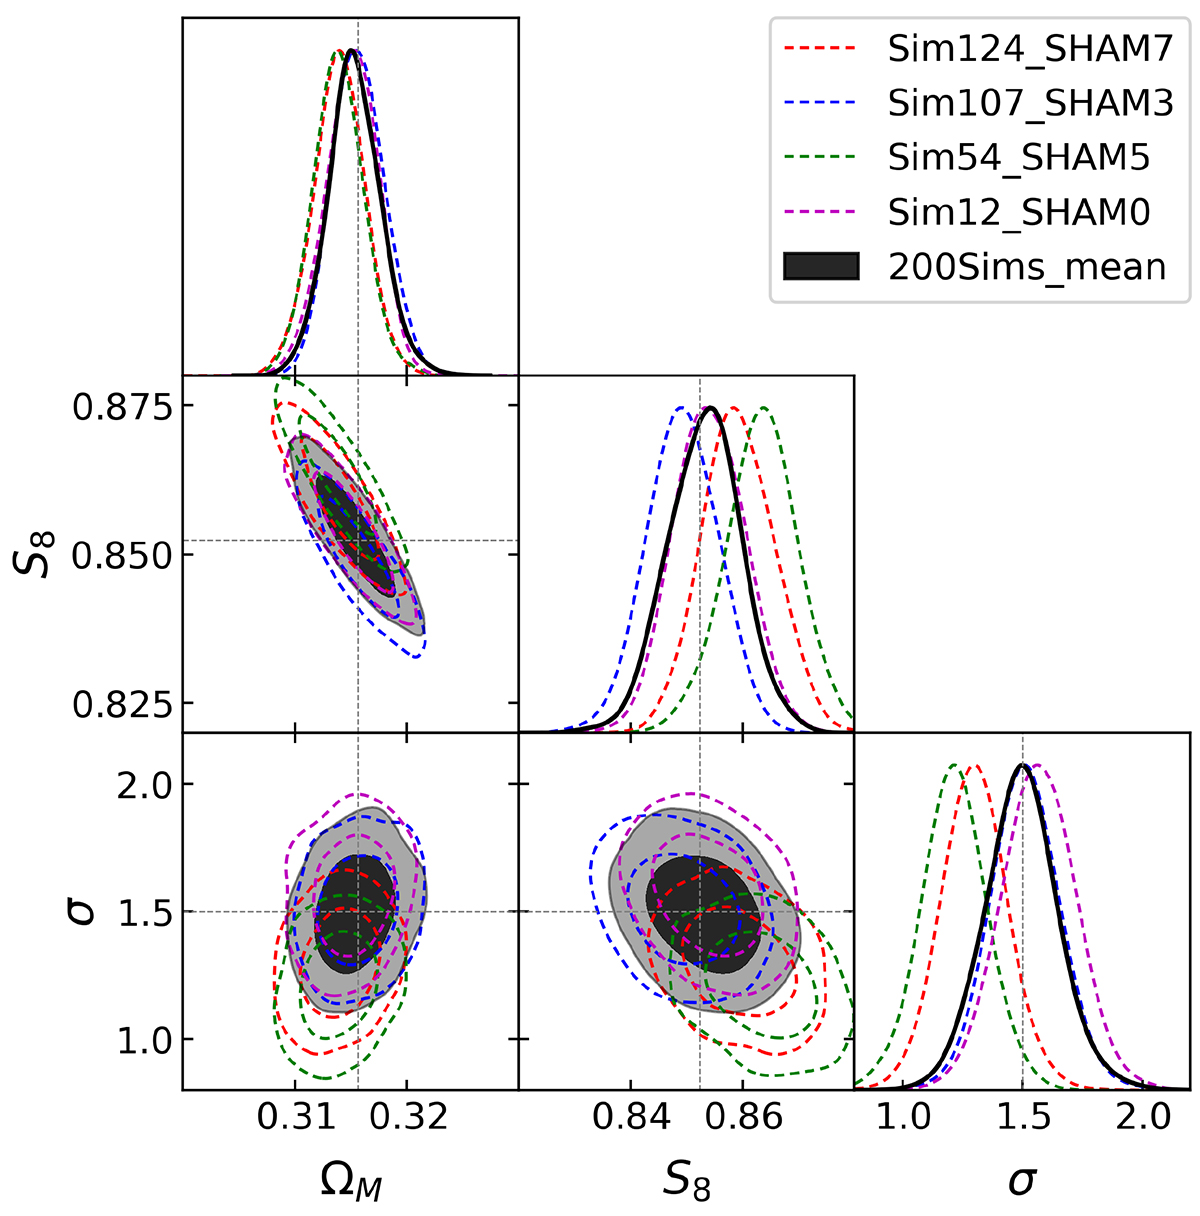
Fig. 9.
Download original image
Same as Fig. 8, but for different realizations. The red, blue, green, and magenta thin contours are the predictions of four realizations randomly chosen in the validation set. The black thick contour represents the prediction of the data vector averaged over all 200 validation samples.
Current usage metrics show cumulative count of Article Views (full-text article views including HTML views, PDF and ePub downloads, according to the available data) and Abstracts Views on Vision4Press platform.
Data correspond to usage on the plateform after 2015. The current usage metrics is available 48-96 hours after online publication and is updated daily on week days.
Initial download of the metrics may take a while.