Open Access
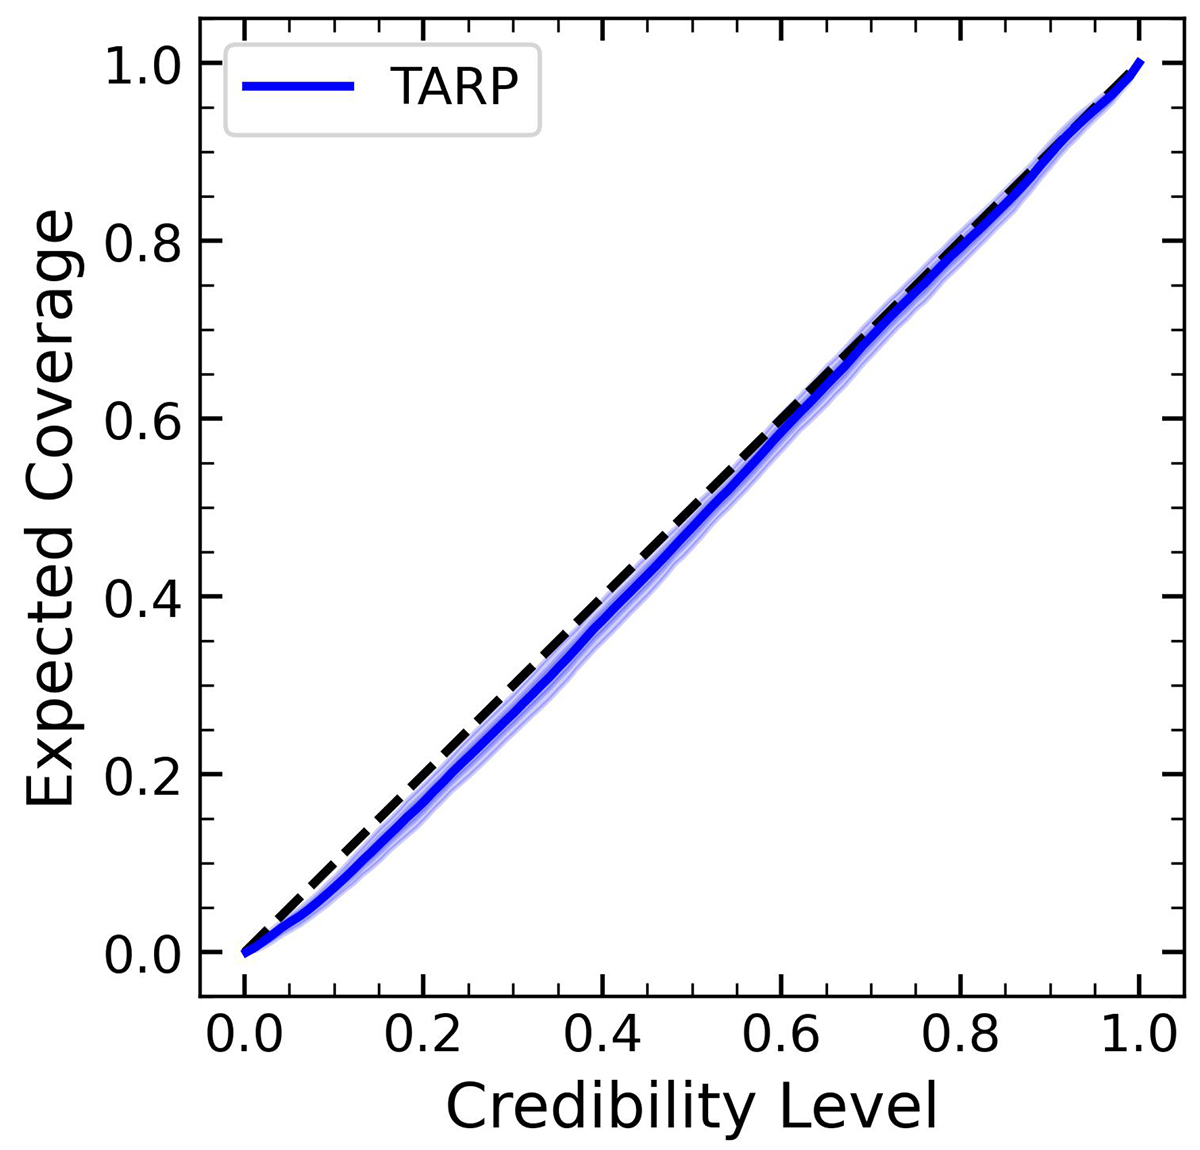
Fig. 7.
Download original image
ECP versus credibility level in TARP. The dark blue region indicates 1−σ credible region from the bootstrapping technique from 100 realizations, while the light region indicates 2−σ. If the uncertainties estimated from the posterior are accurate, the blue line should be along with the diagonal.
Current usage metrics show cumulative count of Article Views (full-text article views including HTML views, PDF and ePub downloads, according to the available data) and Abstracts Views on Vision4Press platform.
Data correspond to usage on the plateform after 2015. The current usage metrics is available 48-96 hours after online publication and is updated daily on week days.
Initial download of the metrics may take a while.