Open Access
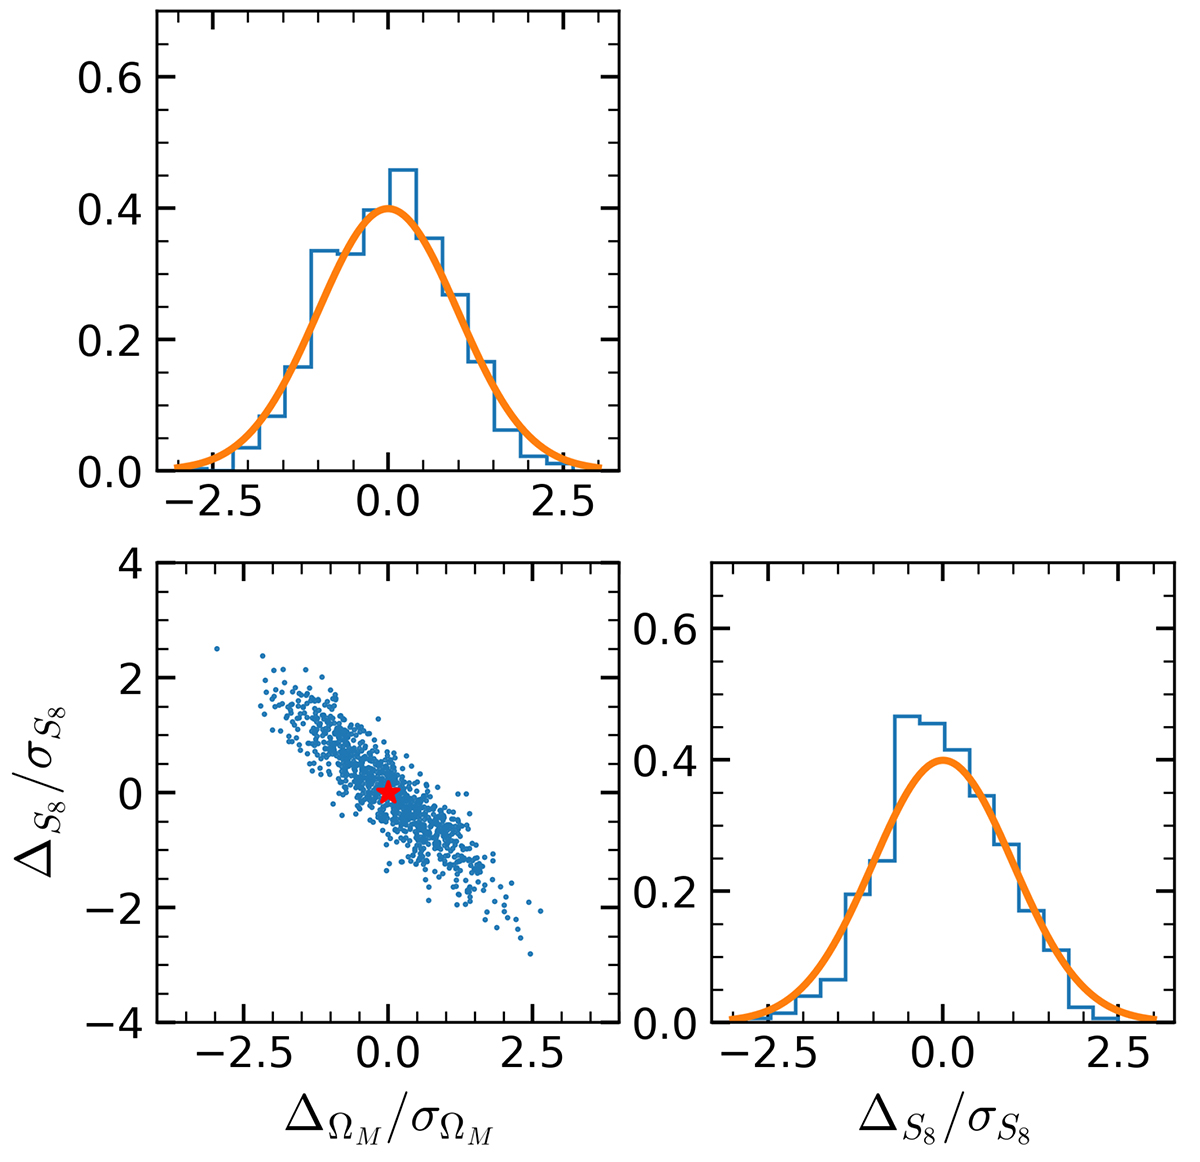
Fig. 6.
Download original image
Differences between predicted values and truths (blue dots), shown in ΩM−S8 plane. The red star represents the truth. We also present the corresponding 1D distribution of the two cosmological parameters, as well as a reference standard normal distribution (orange line). It can be seen that they are greatly consistent.
Current usage metrics show cumulative count of Article Views (full-text article views including HTML views, PDF and ePub downloads, according to the available data) and Abstracts Views on Vision4Press platform.
Data correspond to usage on the plateform after 2015. The current usage metrics is available 48-96 hours after online publication and is updated daily on week days.
Initial download of the metrics may take a while.