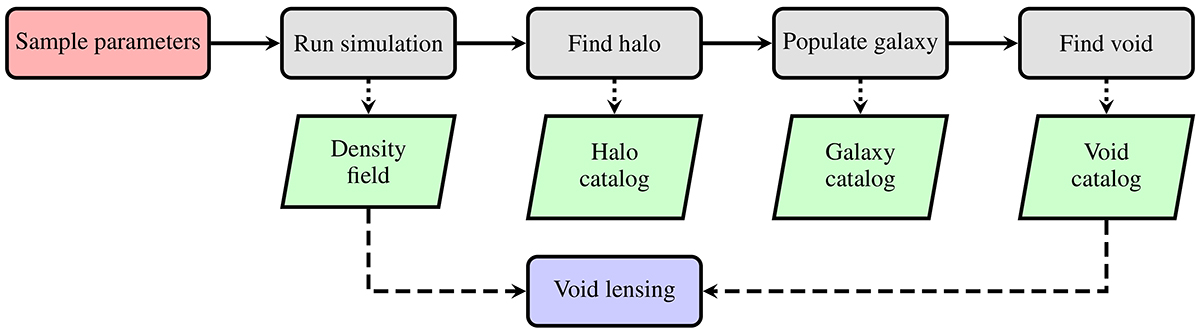
Fig. 2.
Download original image
Schematic diagram of forward modeling. The gray blocks represent modeling processes, the green blocks represent outputs in each step of modeling. The red block represents input parameters in the model. The gray blocks represent steps in forward modeling and the green blocks show the corresponding output in each step. The final output i.e., the void-lensing signal is shown in blue.
Current usage metrics show cumulative count of Article Views (full-text article views including HTML views, PDF and ePub downloads, according to the available data) and Abstracts Views on Vision4Press platform.
Data correspond to usage on the plateform after 2015. The current usage metrics is available 48-96 hours after online publication and is updated daily on week days.
Initial download of the metrics may take a while.