Fig. 10.
Download original image
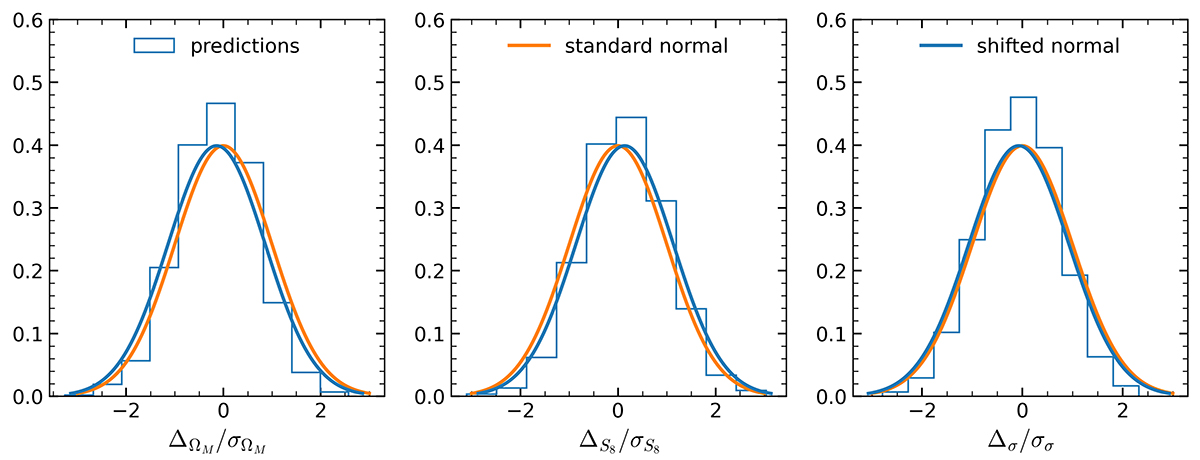
Distributions of SBI predictions on fiducial cosmology. For each panel, the blue histogram shows the distribution of the differences between predictions and truths, rescaled by the predicted standard deviation. The orange line represents the standard normal distribution and the blue curve represents the normal distribution whose mean equals to the average of predictions.
Current usage metrics show cumulative count of Article Views (full-text article views including HTML views, PDF and ePub downloads, according to the available data) and Abstracts Views on Vision4Press platform.
Data correspond to usage on the plateform after 2015. The current usage metrics is available 48-96 hours after online publication and is updated daily on week days.
Initial download of the metrics may take a while.