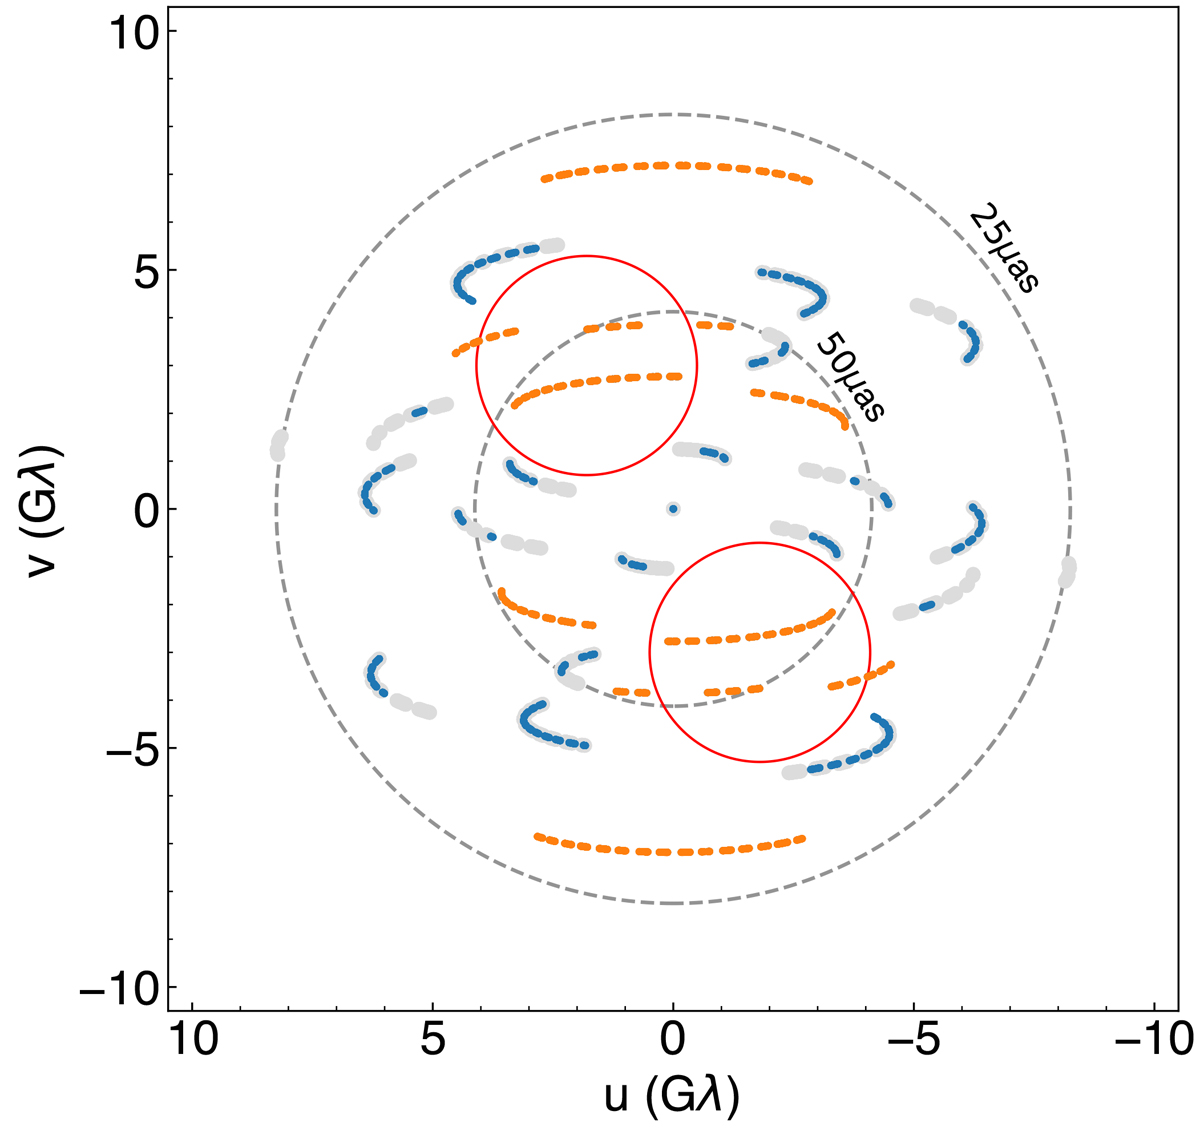
Fig. 1.

Download original image
EHT 2017 and 2018 (u,v)-coverage. The plot shows observations from April 10, 2017 (gray) and April 21, 2018 (blue and orange). Both are at 229.1 GHz, which corresponds to the hi-band and band 4 in EHT 2017 and 2018, respectively. Orange points highlight the GLT baselines. Red circles show the coverage gaps in 2017, and dashed circles mark the 25 and 50 μas resolution.
Current usage metrics show cumulative count of Article Views (full-text article views including HTML views, PDF and ePub downloads, according to the available data) and Abstracts Views on Vision4Press platform.
Data correspond to usage on the plateform after 2015. The current usage metrics is available 48-96 hours after online publication and is updated daily on week days.
Initial download of the metrics may take a while.


