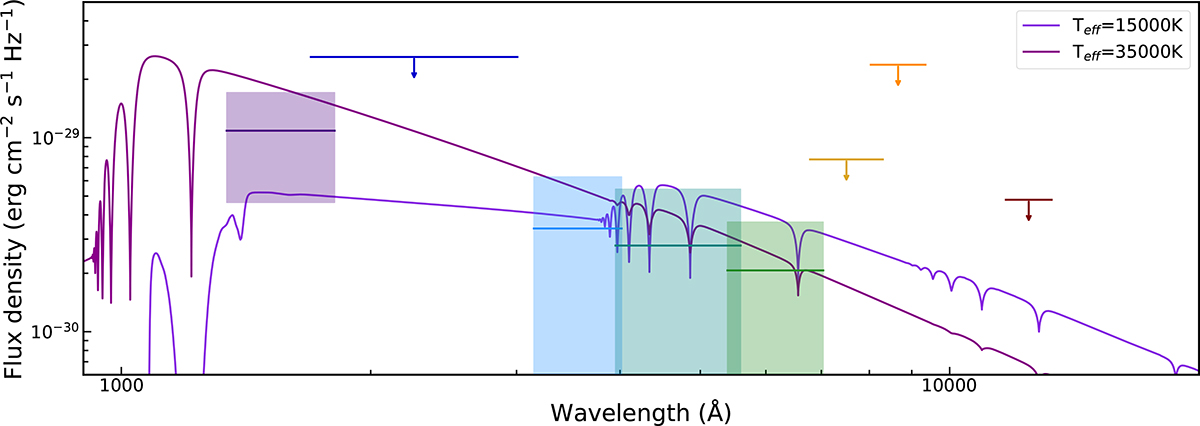
Fig. 8.
Download original image
UV to IR spectrum of J1634+44. The horizontal lines represent the limits and detections in the GALEX FUV (purple) and NUV (dark blue) filters, the UNIONS u (light blue), g (teal), and r (green) filters, the Pan-STARRS i (yellow), z (orange) and y (red) filters, and the UKIRT J filter (dark red). The width of the line shows the wavelength coverage of the filter. The lines with arrows are 3σ upper limits. The lines with shaded regions are detections, where the shaded regions represent 3σ uncertainties. We also plot spectra for an effective temperature of 15 000 K and 35 000 K, which enclose the full range of effective temperatures that satisfy the photometric constraints.
Current usage metrics show cumulative count of Article Views (full-text article views including HTML views, PDF and ePub downloads, according to the available data) and Abstracts Views on Vision4Press platform.
Data correspond to usage on the plateform after 2015. The current usage metrics is available 48-96 hours after online publication and is updated daily on week days.
Initial download of the metrics may take a while.