Fig. 5.
Download original image
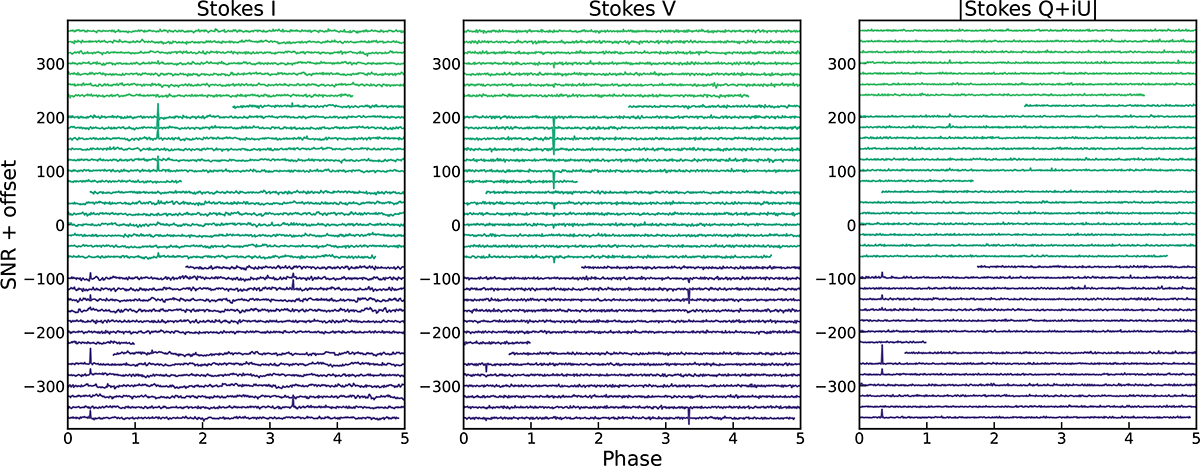
Light curve of all observations, binned to 8 seconds, phase-wrapped using a timing solution with a period of 841 s and a period derivative. The phase zero point is arbitrarily set to the start of the first observation. The left panel shows Stokes I, the middle panel shows Stokes V, and the right panel shows the linear polarisation. The data is plotted chronologically, with the earliest observation at the top and the latest observation at the bottom of the plot. The lines are coloured according to the time of observing, starting with green for the first observation.
Current usage metrics show cumulative count of Article Views (full-text article views including HTML views, PDF and ePub downloads, according to the available data) and Abstracts Views on Vision4Press platform.
Data correspond to usage on the plateform after 2015. The current usage metrics is available 48-96 hours after online publication and is updated daily on week days.
Initial download of the metrics may take a while.