| Issue |
A&A
Volume 699, July 2025
|
|
|---|---|---|
| Article Number | A79 | |
| Number of page(s) | 7 | |
| Section | Interstellar and circumstellar matter | |
| DOI | https://doi.org/10.1051/0004-6361/202555090 | |
| Published online | 08 July 2025 | |
Interstellar water ice analogue properties as a function of temperature: Updated density, porosity, and infrared band strength
1
Centro de Astrobiología (CSIC-INTA),
Ctra. de Ajalvir, km 4, Torrejón de Ardoz,
28850
Madrid,
Spain
2
Faculty of Aerospace Engineering, Delft University of Technology,
Delft,
The Netherlands
3
Leiden Observatory, Leiden University,
PO Box 9513,
NL 2300
RA
Leiden,
The Netherlands
4
Centro de Tecnologías Físicas, Universitat Politècnica de València,
Plaza Ferrándiz-Carbonell,
03801
Alcoy,
Spain
★ Corresponding author: This email address is being protected from spambots. You need JavaScript enabled to view it.
Received:
9
April
2025
Accepted:
5
June
2025
Abstract
Context. Infrared observations of water ice in the interstellar medium are hindered by uncertainties in the band strength, density, and porosity, which introduce considerable errors in the estimated column density of the ice on a line of sight.
Aims. We revise the infrared band strength values and band positions of water ice grown under simulated interstellar conditions at different deposition and warm-up temperatures. We also explore other physical ice parameters: density, refractive index, and porosity.
Methods. We grew water ice in simulated interstellar conditions in ultra-high vacuum with temperatures between 10 and 150 K. We used infrared spectroscopy and laser interferometry to obtain updated values for the band strengths. With these updated values, we calculated and report the density, refractive index, porosity, and infrared band position for water ice.
Results. Previous measurements of these properties were inaccurate because ice was considered non-porous. Our results show that the band strength for the O-H stretching vibration varies significantly with deposition temperature and should not be considered constant. There is also measurable variation of the band strength during the warm-up of the ice after deposition.
Conclusions. Previous ice density values were overestimated due to inaccurate band strengths and the omission of porosity, which can only be considered negligible at very slow growth rates and deposition temperatures close to sublimation. The infrared band position shifts with varying porosity.
Key words: methods: laboratory: solid state / techniques: spectroscopic / ISM: molecules / infrared: ISM
© The Authors 2025
 Open Access article, published by EDP Sciences, under the terms of the Creative Commons Attribution License (https://creativecommons.org/licenses/by/4.0), which permits unrestricted use, distribution, and reproduction in any medium, provided the original work is properly cited.
This article is published in open access under the Subscribe to Open model. This email address is being protected from spambots. You need JavaScript enabled to view it. to support open access publication.
1 Introduction
Infrared (IR) spectroscopy is regularly used in the detection of ices in the interstellar medium. Generally, the most abundant ice component is water ice, and it is of particular interest as a catalyst for chemical reactions (Öberg et al. 2010; Caro & Schutte 2003) as well as a prerequisite for the emergence and sustainability of life (Oró 1961). However, owing to the peculiarity of the water molecule, water ice is especially complex, with a variety of crystalline and amorphous phases, and each one has different properties regarding density, refractive index, and heat conductivity. The position and the shape of the IR vibration bands can be used to identify these phases by comparing observations with IR spectra obtained in the laboratory under similar experimental conditions. At least 19 different crystalline phases of water ice have been found in laboratory experiments as well as four different amorphous phases (Loerting et al. 2020; Artemov 2021).
In cold and dense regions of the interstellar medium, dust grains become covered by icy mantles consisting mainly of water (Williams et al. 1992; Gibb et al. 2004). The accretion and formation of water ice onto dust occurs during the translucent phase in which clouds are shielded enough to allow water ice to become stable (Cuppen & Herbst 2007; Cazaux et al. 2010). The clouds have densities ranging between 103 and 106 particles per cubic centimetre and are subject to different levels of radiation depending on their location (Bergin & Tafalla 2007). These different conditions lead to very different ices with diverse physical properties. This can cause discrepancies when comparing with laboratory ice, which is grown by vapour deposition in ultra-high vacuum (UHV) under growth conditions and temperatures that are well known and reproducible. At temperature T < 40 K, water vapour deposition is expected to grow high density amorphous (HDA) ice, with a density of ρHDA = 1.1 g cm−3 (Narten et al. 1976). For 40 K < T < 120 K, water forms low density amorphous (LDA) ice, with ρLDA = 0.94 g cm−3 (Narten et al. 1976). For T > 120 K, there is a mixture (Mastrapa et al. 2009) of LDA and crystalline cubic ice (Ic), which has a density of ρIc = 0.931 g cm−3 (Petrenko & Whitworth 1999). For T > 150 K, water will deposit and form hexagonal ice; although at the relevant astrophysical pressures of UHV, we cannot deposit any water at those temperatures.
These densities are well known and considered accurate, as they were measured using diffraction in bulk non-porous ices (values are shown in Table 1). However, when growing thin ices by vapour deposition, the accuracy of measured densities is limited by the uncertainty caused by the porosity of the ice, which is intrinsic to the method and is influenced by the experimental setup (e.g. back-filling or directed, deposition angle, chamber pressure). Some recent results measured in simulated astrophysical conditions have shown densities between 0.6 and 0.9 g cm−3 (Dohnálek et al. 2003), even for temperatures that are expected to produce HDA ice. The divergence with bulk ice is often explained by estimating a 35% porosity to compensate for the difference between laboratory analogues (Brown et al. 1996). The angle of incidence can further decrease the density down to 0.2 g cm−3 (Dohnálek et al. 2003) by increasing the porosity with increasing angles, which is driven by columnar growth (González Díaz et al. 2019). There is a clear necessity to distinguish between density and porosity and to develop a standardised experimental method that is reproducible and comparable to observations in the interstellar medium.
In this work, we use laser interferometry and IR spectroscopy to measure the density of ice grown by vapour deposition. This method is accurate and reproducible, but it relies on previous measurements of IR band strength and refractive index, both of which vary with temperature. The refractive index for water ice deposition has recently been measured by Kofman et al. (2019) using an experimental setup similar to ours. A similar work was presented by He et al. (2022), although with faster deposition and thicker ices. The band strength has been updated several times (Mastrapa et al. 2009; Bouilloud et al. 2015), but the generally accepted value still remains the one estimated by Hagen et al. (1981). The latter concluded a single constant value for the band strength of the O-H stretching mode, but it is well known today that band strength varies with temperature and crystallographic phase. Mastrapa et al. (2009) attempted to update the values by taking into account temperature dependence, but they relied on values of water density that were measured for bulk ice and do not consider the porosity of the ice. The most recent attempt to update the band strength was by Bouilloud et al. (2015), who concluded that the uncertainty in porosity and density made their measurements unreliable, and they finally recommended using the older result by Hagen et al. (1981).
As we show in Section 3, using the band strengths calculated by Hagen et al. (1981) or Mastrapa et al. (2009) with our experimental results would yield densities above 1 g cm−3 for the amorphous and crystalline temperature ranges, which are obviously wrong. It has become apparent that in order to be able to measure accurate densities and porosities, corrected values for IR band strengths must first be obtained.
In Section 2, we include details about the laboratory setup and the methods used to derive band strengths, densities, and porosities. In Section 3, we present the experiments performed to calculate the new band strengths and then apply those values to a battery of experiments in a temperature range between 10 and 150 K and a deposition rate approximately between 0.07 nm/s and 0.7 nm/s. In Section 4 we discuss the presented results and compare them with existing works. In Section 5 we explain the potential impact of this work on the astrophysics community. We conclude in Section 6 with a summary of the main conclusions extracted from this work.
Intrinsic water ice densities ρ considering no porosity, according to deposition surface temperature T.
2 Experimental method and mathematical derivations
Experiments were carried out in ISAC, which is described in detail in Muñoz Caro et al. (2010). ISAC is a UHV chamber with a base pressure in the 10−11 mbar range. A closed-cycle helium cryostat and a Lakeshore model 331 temperature controller connected to a silicon diode allowed for control of the temperature over a KBr substrate from 10 to 300 K with an accuracy better than 0.1 K. Distilled MilliQ water (from a Millipore water distribution system IQ-7000) was introduced into the chamber from the gas line, which in ISAC is evacuated with an oil-free pump, under a pressure of ~10−3 mbar. Water vapour from the gas line was introduced into the UHV chamber at a constant pressure, which in different experiments ranged between 5×10⁻⁹ mbar and 5×10⁻⁷ mbar, producing growth rates between 0.02 nm/s and 0.8 nm/s for the deposited ice. The vapour was directed towards the substrate through a stainless steel tube with an angle of 45°. From this position, the laser interferometry and IR spectra could be recorded during deposition of the ice. Additionally, it has been proven that deposition up to an angle close to 45° does not have an important effect on the ice structure (González Díaz et al. 2019).
Laser interferometry was measured continuously with an He-Ne red laser (632.8 nm, 5.0 mW, 500:1 polarisation) and a silicon photodiode power sensor (model S120C), which were placed with an angle of ~6°. We typically grew ices for two full interferometry cycles, producing approximately 0.6 μm of ice thickness.
A Bruker Vertex 70 with a deuterated triglycine sulphate detector (DGTS) was used to measure the Fourier-transformed IR spectroscopy. The IR spectra were acquired with a resolution of 2 cm−1 and 128 scans that correspond to a 4 minute acquisition time. This spectral resolution is often used in experimental simulations, as it provides a good relationship between the acquisition time and the quality of the spectra.
Pressure inside the chamber was recorded with a BayardAlpert sensor, while the composition of the gas phase was constantly monitored for possible contaminants using quadrupole mass spectrometry (QMS; Pfeiffer Vacuum, Prisma QMS 200).
If we define the density, ρ, as the relation between mass and volume, the mass of an ice sample per area unit can be expressed in terms of the molecular mass, m, and the column density, N, while the volume can be calculated with the thickness of the ice, d. Therefore, the density obtained at different temperatures, T, can be expressed as
![Mathematical equation: $\[\rho_{H_2 O}(T)=\frac{m_{H_2 O} \cdot N(T)}{N_A \cdot \mathrm{~d}(T)},\]$](/articles/aa/full_html/2025/07/aa55090-25/aa55090-25-eq1.png) (1)
(1)
where NA is Avogadro’s number. The column density of an ice can be obtained from the IR spectrum, considering the band strength, 𝒜, of any molecular vibration at a given temperature:
![Mathematical equation: $\[N(T)=\frac{1}{\mathcal{A}(T)} \int_{band} \tau_\nu(T) \mathrm{d} \nu=\frac{2.3 \cdot A_{int}(T)}{\mathcal{A}(T)},\]$](/articles/aa/full_html/2025/07/aa55090-25/aa55090-25-eq2.png) (2)
(2)
where τν(T) is the optical depth of the band, which is related to the integrated area of the IR band, Aint(T). For this work, we used the most intense IR absorption band of water ice (centred around 3250 cm−1), as it has the largest signal-to-noise ratio. We substituted Eq. (2) in Eq. (1) and reorganised the terms:
![Mathematical equation: $\[\rho_{H_2 O}(T)=\frac{2.3 \cdot m_{H_2 O} \cdot A_{int}(T)}{N_A \cdot \mathrm{~d}(T) \cdot \mathcal{A}(T)}\]$](/articles/aa/full_html/2025/07/aa55090-25/aa55090-25-eq3.png) (3)
(3)
![Mathematical equation: $\[\mathcal{A}(T)=\frac{2.3 \cdot m_{H_2 O} \cdot A_{\text {int }}(T)}{N_A \cdot \mathrm{~d}(T) \cdot \rho_{H_2 O}(T)}.\]$](/articles/aa/full_html/2025/07/aa55090-25/aa55090-25-eq4.png) (4)
(4)
Equation (4) clearly shows that we can calculate the band strength at any temperature provided that we know the density and the thickness. In Table 2 we show the densities used for this calculation taken from Dohnálek et al. (2003).
For the calculation of the band strengths for all warm-up temperatures using a single experiment, H2O ice was deposited at 10 K. Constants mH2O and NA are known, Aint(T) and d(T) can be measured, and ρH2O was taken from Dohnálek et al. (2003) at 10 K for a similar deposition rate and angle. From the He-Ne laser, d(T) can be obtained (see González Díaz et al. 2022, for calculation details) using the value of the refractive index of the ice from Dohnálek et al. (2003).
Once the value at the deposition temperature was known, the band strength for any other temperature could be obtained easily considering that the column density during warm-up does not change and using the linear relation between band strength and integrated IR absorption:
![Mathematical equation: $\[\frac{\mathcal{A}(T)}{A_{int}(T)}=\frac{\mathcal{A}(10 \mathrm{~K})}{A_{int}(10 \mathrm{~K})} \rightarrow \mathcal{A}(T)=\frac{\mathcal{A}(10 \mathrm{~K}) \cdot A_{int}(T)}{A_{int}(10 \mathrm{~K})}.\]$](/articles/aa/full_html/2025/07/aa55090-25/aa55090-25-eq5.png) (5)
(5)
This assumption is thought to be good as long as the warmup does not lead to an increase of pressure inside the chamber, meaning that there is no thermal desorption of the ice, which in our case is constantly monitored with the quadrupole mass spectrometer. Temperature-programmed desorption experiments have shown that water ice does not lose any column density for T<145 K in UHV (Tamai et al. 2023). From the calculated band strength at every temperature, the density of H2O for various warm-up temperatures was obtained using Eq. (3).
Water ice densities, ρ, reported by Dohnálek et al. (2003) used for the calculation of our updated band strengths according to surface temperature, T.
3 Results
First we obtained the updated values for the IR band strength. Then, we applied those corrected values to study the density, refractive index, and porosity of the water ice deposited in a range of temperatures and growth rates.
3.1 Updated band strengths
Water ice was grown by vapour deposition on a cold substrate at temperatures between 10 and 150 K. In order to reproduce the densities of Dohnálek et al. (2003), all of these ices were grown at 0.07 nm/s, which we can accurately measure using laser interferometry. It is important to control the deposition rate accurately and constantly, as it affects the morphology and porosity of the ice (Bossa et al. 2015). For instance, a faster deposition produces more porous ice, resulting in a lower column density, N, and average density, ρ. We then used the integrated IR absorbance and the thickness of our ice to calculate the updated band strengths using Eq. (4). The results are plotted in Figure 1 for seven different experiments at temperatures between 10 and 150 K.
A similar experiment was performed from a single deposition starting at 10 K that was then slowly warmed up to 150 K while calculating the band strength at 10 K intervals with Eq. (5). At 150 K, the QMS detects some desorption of water molecules, which means that the column density of the ice is no longer constant, and we cannot calculate band strengths at higher temperatures. The heating was applied at 0.2 K/min to allow enough time for phase transitions and pore coalescence. The two methods resulted in similar values for T < 70 K, but there is a notable divergence for warmer temperatures, which we address in Section 4.
Figure 1 also displays the band strength values by Hagen et al. (1981) and Mastrapa et al. (2009), which are currently the most commonly used values in IR analysis. The same values plotted in Figure 1 are detailed in Table 3 for reference.
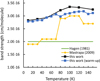 |
Fig. 1 Band strength for the O-H stretching mode of water. Updated values (black) were calculated using Eq. (4) from different experiments at the indicated temperature. Warm up values (blue) were calculated using Eq. (5) from a single experiment deposited at 10 and warmed up to 150 K. |
3.2 Density and porosity versus temperature
With these updated values of the band strength, we performed experiments in a range of temperatures (between 10 and 150 K) and pressures (between 1×10⁻⁸ and 5×10⁻⁷ mbar), leading to deposition rates between 0.07 and 0.70 nm/s. We used the integrated absorbance from the IR and the thickness from the laser interferometry to calculate the densities using Eq. (1). For this calculation, we chose to use the band strengths obtained from independent depositions instead of the single warm-up experiment because the phase transitions of water ice cannot be fully completed during the warm-up independently of the heating rate, as we discuss in Section 4.
The calculated densities are plotted in Figure 2, where each dot represents a different experiment. The linear fits have been added for clarity, although the dependence is not necessarily linear, as was discussed in Berland et al. (1995) and Satorre et al. (in prep. 2025).
From these results, we could immediately estimate the porosity of the ice as a ratio between the average density and intrinsic density:
![Mathematical equation: $\[p=1-\frac{\rho_{average}}{\rho_{intrinsic}},\]$](/articles/aa/full_html/2025/07/aa55090-25/aa55090-25-eq6.png) (6)
(6)
where the intrinsic densities are those shown in Table 1. All values for ρintrinsic were obtained using diffraction experiments, and they are not affected by porosity. Any uncertainty in our porosity estimations is due to our own ρaverage calculations. The resulting porosities for the same experiments are shown in Figure 3. One can see that porosity is higher for colder surface temperatures, as diffusion is impeded, reaching a maximum of 0.42 at 10 K.
The porosity tends to zero for very slow depositions at higher temperatures. In our experimental conditions of UHV, 150 K is the highest temperature at which water ice will deposit, leading to a porosity of 0.07.
We also studied the band position as a function of porosity for the IR O-H stretching band (Figure 4). It is known that the band peak will shift to lower wavenumbers for higher deposition temperatures (see Figure 4), but our results also show the band will shift to higher wavenumbers with increasing porosity, which can be used in astronomical observations as an indicator of porosity. This effect is most notable for the amorphous ices at 10 and 30 K, while the wavenumber is mostly constant at higher temperatures, especially at 150 K, in which case all the ice is expected to be crystalline.
Water ice IR band strengths for the O-H anti-symmetric stretching.
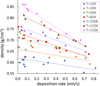 |
Fig. 2 Density of water ice deposited at indicated temperatures and deposition rates. The density increases at higher temperatures and decreases at faster deposition rates as a consequence of porosity. Linear fits are included for clarity. |
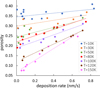 |
Fig. 3 Porosity of water ice deposited at indicated temperatures and deposition rates, calculated using Eq. (6) and intrinsic densities from Table 1. Porosity increases at lower temperatures and faster deposition rates. |
3.3 Refractive index
We can estimate the refractive index, n(λ), of our ice in the visible wavelength by applying our density measurements to the Lorentz-Lorenz relation (Kragh 2018):
![Mathematical equation: $\[R(\lambda)=\frac{1}{\rho(T)} \frac{n(\lambda)^2-1}{n(\lambda)^2+2},\]$](/articles/aa/full_html/2025/07/aa55090-25/aa55090-25-eq7.png) (7)
(7)
where R(λ) is the specific refraction. In our case, we used a He-Ne laser with λ = 632.8 nm, so we used R(632.8 nm) = 0.2072 g cm−3 (Brown et al. 1996). In Figure 5 we show the resulting refractive index for all of our experiments, with deposition rates between 0.07 and 0.7 nm/s. One can see that the refractive index has a strong variation with deposition rate, with faster depositions leading to a higher porosity, lower density, and lower refractive index. Ices studied in astronomical observations are expected to grow more slowly and be less porous (Bossa et al. 2012), so the higher range of our refractive indexes would apply.
We can extract the real part, n, of the complex refractive index of the ice for the whole IR spectrum using the Kramers-Kronig iterative method as described by Bergren et al. (1978); Ehrenfreund et al. (1997). This method uses the IR absorbance in our range of wavelengths as well as an initial value for n in the visible range, which in our case is the value obtained with Eq. (7). The results of this method are shown in Figure 6 (top) for experiments deposited at 0.07 nm/s. Figure 6 (middle) shows the values of n at the highest wavenumber we can measure in our IR spectrometer, which is expected to coincide with n at visible wavelengths. These values are in good agreement with existing publications (Berland et al. 1995); however, the accuracy of this method is dependent on the initial values of the iteration. We can also appreciate the redshift of the band peak with increasing deposition temperatures, with a notable step between 100 and 120 K, coinciding with the transition temperature between amorphous and crystalline phases.
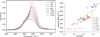 |
Fig. 4 Left: infrared absorbance for the O-H stretching IR band for water ice deposited at 0.07 nm/s at the indicated surface temperatures. Right: wavenumber of the band peak for all experiments in this work with deposition rates between 0.07 and 0.70 nm/s. |
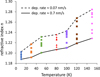 |
Fig. 5 Refractive index for all experiments with deposition rates between 0.07 and 0.70 nm/s, calculated using the Lorenz-Lorentz equation. |
4 Discussion
In the results presented in Section 3, we performed experiments and extracted band strengths following the approach of Mastrapa et al. (2009) but applying densities from Dohnálek et al. (2003). We chose to replicate their work because their experimental conditions are the closest to ours, and we consider them to be the most reliable measurements for water ice grown by vapour deposition because ice was grown in UHV with fine control of the deposition rate. Dohnálek et al. (2003) did not use IR spectroscopy, so they could not produce updated results for band strengths. Our experiment mainly differs from Mastrapa et al. (2009) by using a slower deposition rate, which is closer to ice mantle accretion on cosmic dust grains and can be controlled by the water vapour pressure in the vacuum chamber.
We also examined the differences in ice behaviour when the surface temperature is slowly heated from 10 to 150 K, instead of depositing vapour directly at a target temperature. The two methods result in similar band strength values for T < 70 K, where the ice is expected to be fully amorphous. However, there is a notable divergence for warmer temperatures starting at 80 K, which is when some water molecules start to crystallise (Olander & Rice 1972). The cause of this separation is that the crystal phase transition is diffusion limited, so once the crystals start to grow, the movement of molecules is limited by the crystal grain boundaries. The crystallisation is expected to be complete at 120 K, but the resulting internal structure will not be the same as if it were grown at that temperature from vapour deposition. This difference between warmed up ices and those deposited at temperature T is expected and confirms previous experiments by Jenniskens & Blake (1994), where HDA ice was grown at T < 38 K and maintained some amorphous characteristics during warm-up, even at temperatures above the crystal transition (Jenniskens et al. 1995). Similar results were found by Olander & Rice (1972), where the crystallisation was yet to be completed after several days at T = 140 K.
With either approach, our work introduces a significant correction to the previously accepted band strength of water calculated by Hagen et al. (1981) and updated by Mastrapa et al. (2009). This correction is justified by taking into account the porosity of the ice, which was not considered by Hagen nor Mastrapa. However, porosity was taken into account in the more accurate measurements of density by Dohnálek et al. (2003), which are the base of our calculations.
With the updated values for band strengths at all temperatures, we then measured the ice density for a range of deposition rates and surface temperatures. We observed an increase in density with increasing temperatures, as was expected. The surface temperature causes additional diffusion on the growing ice surface, which reduces porosity (Bossa et al. 2014). For each temperature, we also observed a dependence related to deposition rates, with lower densities being produced (higher porosity) at faster rates. Faster deposition rates also produce greater porosity, an effect that has been previously observed in simulations of ice growth (Cazaux et al. 2015) and that can be explained as a self-diffusion limited growth process (Nie et al. 2009; Hama & Watanabe 2013). The resulting morphologies have previously been studied using transmission electron microscopy (Kouchi et al. 2021). Our results contradict those of Westley et al. (1998), which claimed that density was independent of the growth rate, although in that work the authors also did not see a variation in density with surface temperature. While porosity should always be considered for ices grown from vapour deposition, we found that it is less notable for higher surface temperatures and for slower deposition rates, but it is always expected to be non-negligible for ices in the interstellar medium (Bossa et al. 2015).
We also studied the IR band position as a function of porosity for the O-H stretching band. It is known that the band peak will shift to lower wavenumbers for higher deposition temperatures, but our results also show the band will shift to higher wavenumbers with increasing porosity. This can be used in astronomical observations as an indicator of porosity, provided one has a good estimate of the temperature of the ice, which can be estimated from the shape of the IR band (see Figure 4 left). In this way, an observer can at least estimate a range of porosities for a specific ice at a set temperature (see Figure 4 right). This method is especially reliable for ices between 30 and 120 K, as colder temperatures produce a broad amorphous band where the maximum is not well defined, and in warmer temperatures, the band position is almost constant, with most of the ice expected to be crystalline. A similar effect was recently used as a prediction of porosity by Schiltz et al. (2024) in CO2 and H2O ice mixtures in the laboratory to explain the main CO2 feature on Ganymede, a Jovian moon.
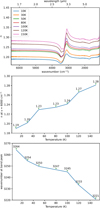 |
Fig. 6 Top: refractive index for the indicated deposition temperatures calculated from IR absorbance for ices deposited at 0.07 nm/s and using the Kramers-Kronig method with initial values from Fig. 5. Middle: refractive index, n, at the wavenumber of 6000 cm−1, which is expected to match n in the visible spectrum. Bottom: wavenumber at the centre of the IR band. |
5 Astrophysical implications
The recent deployment of the James Webb Space Telescope (JWST) has enabled unprecedented sensitivity and resolution for the analysis of ices in the interstellar medium by IR spectroscopy (McClure et al. 2023). In the following years, we expect much work will be published using the state-of-the-art NIRSpec instrument on JWST. To be able to interpret these observations, accurate band strengths are essential. However, as shown in this work, the commonly used band strengths are not accurate, and the extracted conclusions remain marred by the inaccuracies of measurements and calculations made decades ago (Bouilloud et al. 2015). More accurate measurements for band strengths are urgently needed, especially in the case of water.
Water ice density is used for estimating relative-to-water abundances in IR observations. The errors in these estimations have always been large but were considered unavoidable, owing to the uncertainties in density. Using more accurate band strengths for all temperatures as well as for warmed-up ices will significantly reduce these errors. With our new band strength of 2.82×10⁻¹⁶ (value at 10 K, for other temperatures see Table 3), the column densities are up to 40% smaller, and therefore the relative-to-water abundances of other ice species are greater by a factor of 1.4.
Interpreting observations of interstellar ice is always conditioned by a lack of knowledge about its porosity, which is influenced by its formation temperature and pressure. Pores in the ice act as reaction sites for chemical processes, but the heating by radiation causes a collapse of the pores (Bossa et al. 2015), reducing the number of reaction sites in the bulk and limiting chemical processes to the surface. Gaining a better understanding of the porosity through IR band positions can help explain the chemistry of the ice and should be considered in kinetic models.
Pore collapse during heating can also lead to the formation of larger pores when smaller ones coalesce (Cazaux et al. 2015). This process allows trapped chemical species to meet in those larger spaces, enabling chemistry that cannot happen until certain temperatures are reached. The JWST NIRSpec observation of icy moons (Villanueva et al. 2023) has shown that water ice can evolve during one day on Ganymede (Schiltz et al. 2024; Bockelée-Morvan et al. 2024), transitioning from fresh crystalline water ice to more amorphous ice. Such evolution, as well as the changes in ice properties, could be due to temperature fluctuations or radiation. In this work, we provide elements to interpret the change in position of the water band and link such changes to porosity changes or temperature. In the future, a reflectance model using our results will allow for quantitative characterisation of the changes due to the processes occurring on these moons. For this reason, it is important to consider the differences in band strengths whether the ice was recently deposited or was slowly warmed up, as is the case in the day-night cycles of the frozen moons of Jupiter (Schiltz et al. 2024).
Accurate band strengths are also fundamental in the building of models for synthetic IR spectra (Taillard et al. 2025). Some ice analogues cannot be reproduced in the laboratory, either because they are rare molecules (or isotopes) or because they are complex mixtures of many different species. In such cases, the modelling of synthetic IR spectra has proven to be more successful as well as faster and more efficient.
6 Conclusions
We reevaluated the IR spectroscopy features of water ice, and experimentally studied physical properties such as density and porosity for different deposition temperatures and pressures. We list the following conclusions:
We have updated the values for IR band strengths at temperatures between 10 and 150 K, whether the ice was deposited or warmed up to that temperature. This result implies an important correction over the values that have been used since Hagen et al. (1981). This correction implies that relative-to-water abundances of other species (e.g. CO, CO2, CH3OH, NH3) in ice mantles that have been calculated from IR observations are underestimated by 40%. The corrected abundances are the previously published values multiplied by a factor of 1.4.
With the new values for the band strengths and knowing the intrinsic density of a non-porous ice, we measured the effective density of porous vapour-deposited ices. We have presented updated values for densities at all temperatures.
We have shown that the porosity of water ice grown by vapour deposition varies with growth rate, which can be controlled with the vapour pressure in the vacuum chamber. The amount of porosity increases with the growth rate but is almost always significant. This explains why previous measurements of water ice density produced much lower values than bulk ice (Brown et al. 1996; Dohnálek et al. 2003).
We observed a shift in the position of the O-H IR band due to the variation of the effective density of the ice. We have presented the band position as a function of porosity, which can be used to infer the porosity of astrophysical ices.
The previously available IR band strengths for water ice are known to be inaccurate. Our updated values offer a preferable alternative for the study of ices in the interstellar medium.
Acknowledgements
This research has been funded by the projects PID2020-118974GB-C21, PID2020-118974GB-C22, PID2023-151513NB-C21, and PID2023-151513NB-C22 by the Spanish Ministry of Science and Innovation. B.E. acknowledges the support by grant PTA2020-018247-I from the Spanish Ministry of Science and Innovation/State Agency of Research MCIN/AEI.
References
- Artemov, V. 2021, The Electrodynamics of Water and Ice (Berlin: Springer), 1 [Google Scholar]
- Bergin, E. A., & Tafalla, M. 2007, Annu. Rev. Astron. Astrophys., 45, 339 [Google Scholar]
- Bergren, M. S., Schuh, D., Sceats, M. G., & Rice, S. A. 1978, J. Chem. Pys., 69, 3477 [Google Scholar]
- Berland, B., Brown, D., Tolbert, M., & George, S. 1995, Geophys. Res. Lett., 22, 3493 [Google Scholar]
- Bockelée-Morvan, D., Lellouch, E., Poch, O., et al. 2024, A&A, 681, A27 [NASA ADS] [CrossRef] [EDP Sciences] [Google Scholar]
- Bossa, J.-B., Isokoski, K., De Valois, M., & Linnartz, H. 2012, A&A, 545, A82 [NASA ADS] [CrossRef] [EDP Sciences] [Google Scholar]
- Bossa, J.-B., Isokoski, K., Paardekooper, D., et al. 2014, A&A, 561, A136 [NASA ADS] [CrossRef] [EDP Sciences] [Google Scholar]
- Bossa, J.-B., Maté, B., Fransen, C., et al. 2015, ApJ, 814, 47 [NASA ADS] [CrossRef] [Google Scholar]
- Bouilloud, M., Fray, N., Bénilan, Y., et al. 2015, MNRAS, 451, 2145 [Google Scholar]
- Brown, D., George, S. M., Huang, C., et al. 1996, J. Phys. Chem., 100, 4988 [Google Scholar]
- Caro, G. M., & Schutte, W. 2003, A&A, 412, 121 [NASA ADS] [CrossRef] [EDP Sciences] [Google Scholar]
- Cazaux, S., Bossa, J.-B., Linnartz, H., & Tielens, A. 2015, A&A, 573, A16 [NASA ADS] [CrossRef] [EDP Sciences] [Google Scholar]
- Cazaux, S., Cobut, V., Marseille, M., Spaans, M., & Caselli, P. 2010, A&A, 522, A74 [NASA ADS] [CrossRef] [EDP Sciences] [Google Scholar]
- Cuppen, H., & Herbst, E. 2007, ApJ, 668, 294 [Google Scholar]
- Dohnálek, Z., Kimmel, G. A., Ayotte, P., Smith, R. S., & Kay, B. D. 2003, J. Chem. Phys., 118, 364 [CrossRef] [Google Scholar]
- Ehrenfreund, P., Boogert, A., Gerakines, P., Tielens, A., & Van Dishoeck, E. 1997, A&A, 328, 649 [NASA ADS] [Google Scholar]
- Gibb, E., Whittet, D., Boogert, A., & Tielens, A. 2004, ApJS, 151, 35 [NASA ADS] [CrossRef] [Google Scholar]
- González Díaz, C., Carrascosa, H., Muñoz Caro, G. M., Satorre, M. Á., & Chen, Y. J. 2022, MNRAS, 517, 5744 [CrossRef] [Google Scholar]
- González Díaz, C., Carrascosa de Lucas, H., Aparicio, S., et al. 2019, MNRAS, 486, 5519 [CrossRef] [Google Scholar]
- Hagen, W., Tielens, A. G. G. M., & Greenberg, J. M. 1981, Chem. Phys., 56, 367 [NASA ADS] [CrossRef] [Google Scholar]
- Hama, T., & Watanabe, N. 2013, Chem. Rev., 113, 8783 [Google Scholar]
- He, J., Diamant, S. J. M., Wang, S., et al. 2022, ApJ, 925, 179 [NASA ADS] [CrossRef] [Google Scholar]
- Jenniskens, P., Blake, D., Wilson, M., & Pohorille, A. 1995, ApJ, 455, 389 [NASA ADS] [CrossRef] [Google Scholar]
- Jenniskens, P., & Blake, D. F. 1994, Science, 265, 753 [NASA ADS] [CrossRef] [Google Scholar]
- Kofman, V., He, J., ten Kate, I. L., & Linnartz, H. 2019, ApJ, 875, 131 [NASA ADS] [CrossRef] [Google Scholar]
- Kouchi, A., Tsuge, M., Hama, T., et al. 2021, ApJ, 918, 45 [NASA ADS] [CrossRef] [Google Scholar]
- Kragh, H. 2018, Substantia, 2, 7 [Google Scholar]
- Kuhs, W., Bliss, D., & Finney, J. 1987, Le Journal de Physique Colloques, 48, C1 [Google Scholar]
- Loerting, T., Fuentes-Landete, V., Tonauer, C. M., & Gasser, T. M. 2020, Commun. Chem., 3, 109 [Google Scholar]
- Mastrapa, R. M., Sandford, S. A., Roush, T. L., Cruikshank, D. P., & Dalle Ore, C. M. 2009, ApJ, 701, 1347 [NASA ADS] [CrossRef] [Google Scholar]
- McClure, M. K., Rocha, W. R. M., Pontoppidan, K. M., et al. 2023, Nat. Astron., 7, 431 [NASA ADS] [CrossRef] [Google Scholar]
- Muñoz Caro, G. M., Jiménez-Escobar, A., Martín-Gago, J. Á., et al. 2010, A&A, 522, A108 [NASA ADS] [CrossRef] [EDP Sciences] [Google Scholar]
- Narten, A., Venkatesh, C.-G., & Rice, S. 1976, J. Chem. Pys., 64, 1106 [Google Scholar]
- Nie, S., Bartelt, N., & Thürmer, K. 2009, PRL, 102, 136101 [Google Scholar]
- Öberg, K. I., Van Dishoeck, E. F., Linnartz, H., & Andersson, S. 2010, ApJ, 718, 832 [Google Scholar]
- Olander, D. S., & Rice, S. A. 1972, PNAS, 69, 98 [Google Scholar]
- Oró, J. 1961, Nature, 190, 389 [CrossRef] [Google Scholar]
- Petrenko, V. F., & Whitworth, R. W. 1999, Physics of Ice (Oxford: Oxford University Press) [Google Scholar]
- Röttger, K., Endriss, A., Ihringer, J., Doyle, S., & Kuhs, W. 1994, Acta Crystallogr., Sect. B: Struct. Sci, 50, 644 [Google Scholar]
- Schiltz, L., Escribano, B., Caro, G. M., et al. 2024, A&A, 688, A155 [NASA ADS] [CrossRef] [EDP Sciences] [Google Scholar]
- Taillard, A., Martín-Doménech, R., Carrascosa, H., et al. 2025, A&A, 694, A263 [NASA ADS] [CrossRef] [EDP Sciences] [Google Scholar]
- Tamai, C., Maté, B., Cazaux, S., & Satorre, M. Á. 2023, A&A, 675, A47 [Google Scholar]
- Villanueva, G., Hammel, H., Milam, S., et al. 2023, Science, 381, 1305 [NASA ADS] [CrossRef] [Google Scholar]
- Westley, M. S., Baratta, G., & Baragiola, R. 1998, J. Chem. Pys., 108, 3321 [Google Scholar]
- Williams, D., Hartquist, T., & Whittet, D. 1992, MNRAS, 258, 599 [Google Scholar]
All Tables
Intrinsic water ice densities ρ considering no porosity, according to deposition surface temperature T.
Water ice densities, ρ, reported by Dohnálek et al. (2003) used for the calculation of our updated band strengths according to surface temperature, T.
All Figures
|
Fig. 1 Band strength for the O-H stretching mode of water. Updated values (black) were calculated using Eq. (4) from different experiments at the indicated temperature. Warm up values (blue) were calculated using Eq. (5) from a single experiment deposited at 10 and warmed up to 150 K. |
| In the text | |
|
Fig. 2 Density of water ice deposited at indicated temperatures and deposition rates. The density increases at higher temperatures and decreases at faster deposition rates as a consequence of porosity. Linear fits are included for clarity. |
| In the text | |
|
Fig. 3 Porosity of water ice deposited at indicated temperatures and deposition rates, calculated using Eq. (6) and intrinsic densities from Table 1. Porosity increases at lower temperatures and faster deposition rates. |
| In the text | |
|
Fig. 4 Left: infrared absorbance for the O-H stretching IR band for water ice deposited at 0.07 nm/s at the indicated surface temperatures. Right: wavenumber of the band peak for all experiments in this work with deposition rates between 0.07 and 0.70 nm/s. |
| In the text | |
|
Fig. 5 Refractive index for all experiments with deposition rates between 0.07 and 0.70 nm/s, calculated using the Lorenz-Lorentz equation. |
| In the text | |
|
Fig. 6 Top: refractive index for the indicated deposition temperatures calculated from IR absorbance for ices deposited at 0.07 nm/s and using the Kramers-Kronig method with initial values from Fig. 5. Middle: refractive index, n, at the wavenumber of 6000 cm−1, which is expected to match n in the visible spectrum. Bottom: wavenumber at the centre of the IR band. |
| In the text | |
Current usage metrics show cumulative count of Article Views (full-text article views including HTML views, PDF and ePub downloads, according to the available data) and Abstracts Views on Vision4Press platform.
Data correspond to usage on the plateform after 2015. The current usage metrics is available 48-96 hours after online publication and is updated daily on week days.
Initial download of the metrics may take a while.