Fig. 3.
Download original image
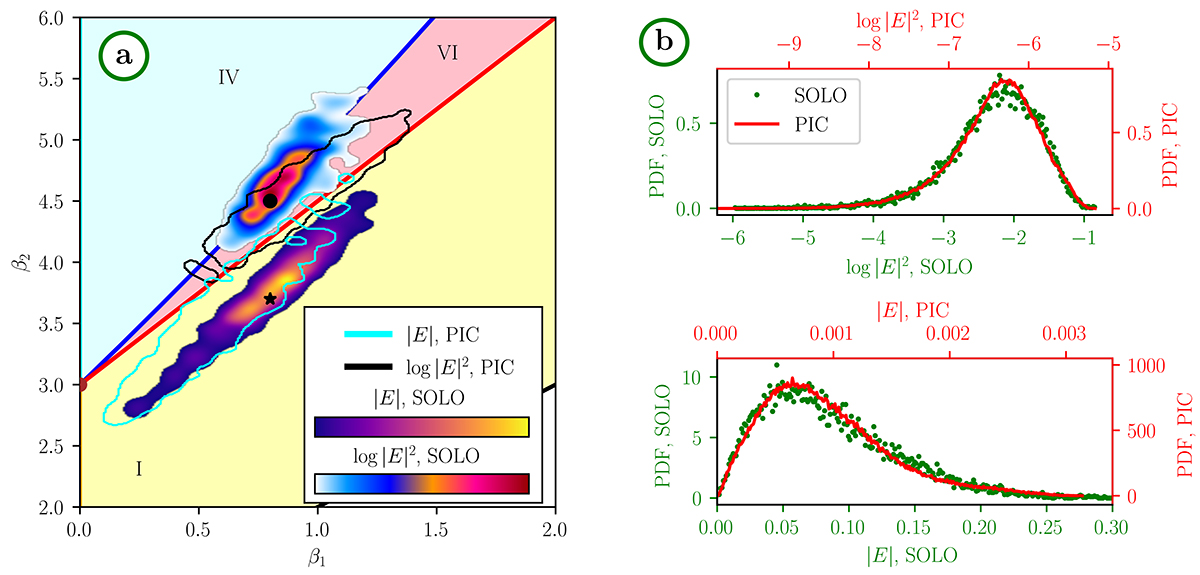
Panel (a): β distributions of the PDFs of |E| and log|E|2 (see legend) for waveforms provided by the RPW-TDS receiver on board Solar Orbiter, with the sampling rate 262 kHz (on January 17, 2023). Contour boundaries of β distributions obtained using waveforms provided by a simulation with ΔN = 0.025 and Ω = 0.01 are superimposed; black and cyan contours correspond to the β distributions of the PDFs of log|E|2 and |E|, respectively. Panel (b): Example of PDFs measured by Solar Orbiter (green dots) and calculated by the simulation with ΔN = 0.025 and Ω = 0.01 (red lines) at positions in the Pearson diagram indicated by a black dot (log|E|2) and a black star (|E|), respectively (see legend).
Current usage metrics show cumulative count of Article Views (full-text article views including HTML views, PDF and ePub downloads, according to the available data) and Abstracts Views on Vision4Press platform.
Data correspond to usage on the plateform after 2015. The current usage metrics is available 48-96 hours after online publication and is updated daily on week days.
Initial download of the metrics may take a while.