Fig. 1.
Download original image
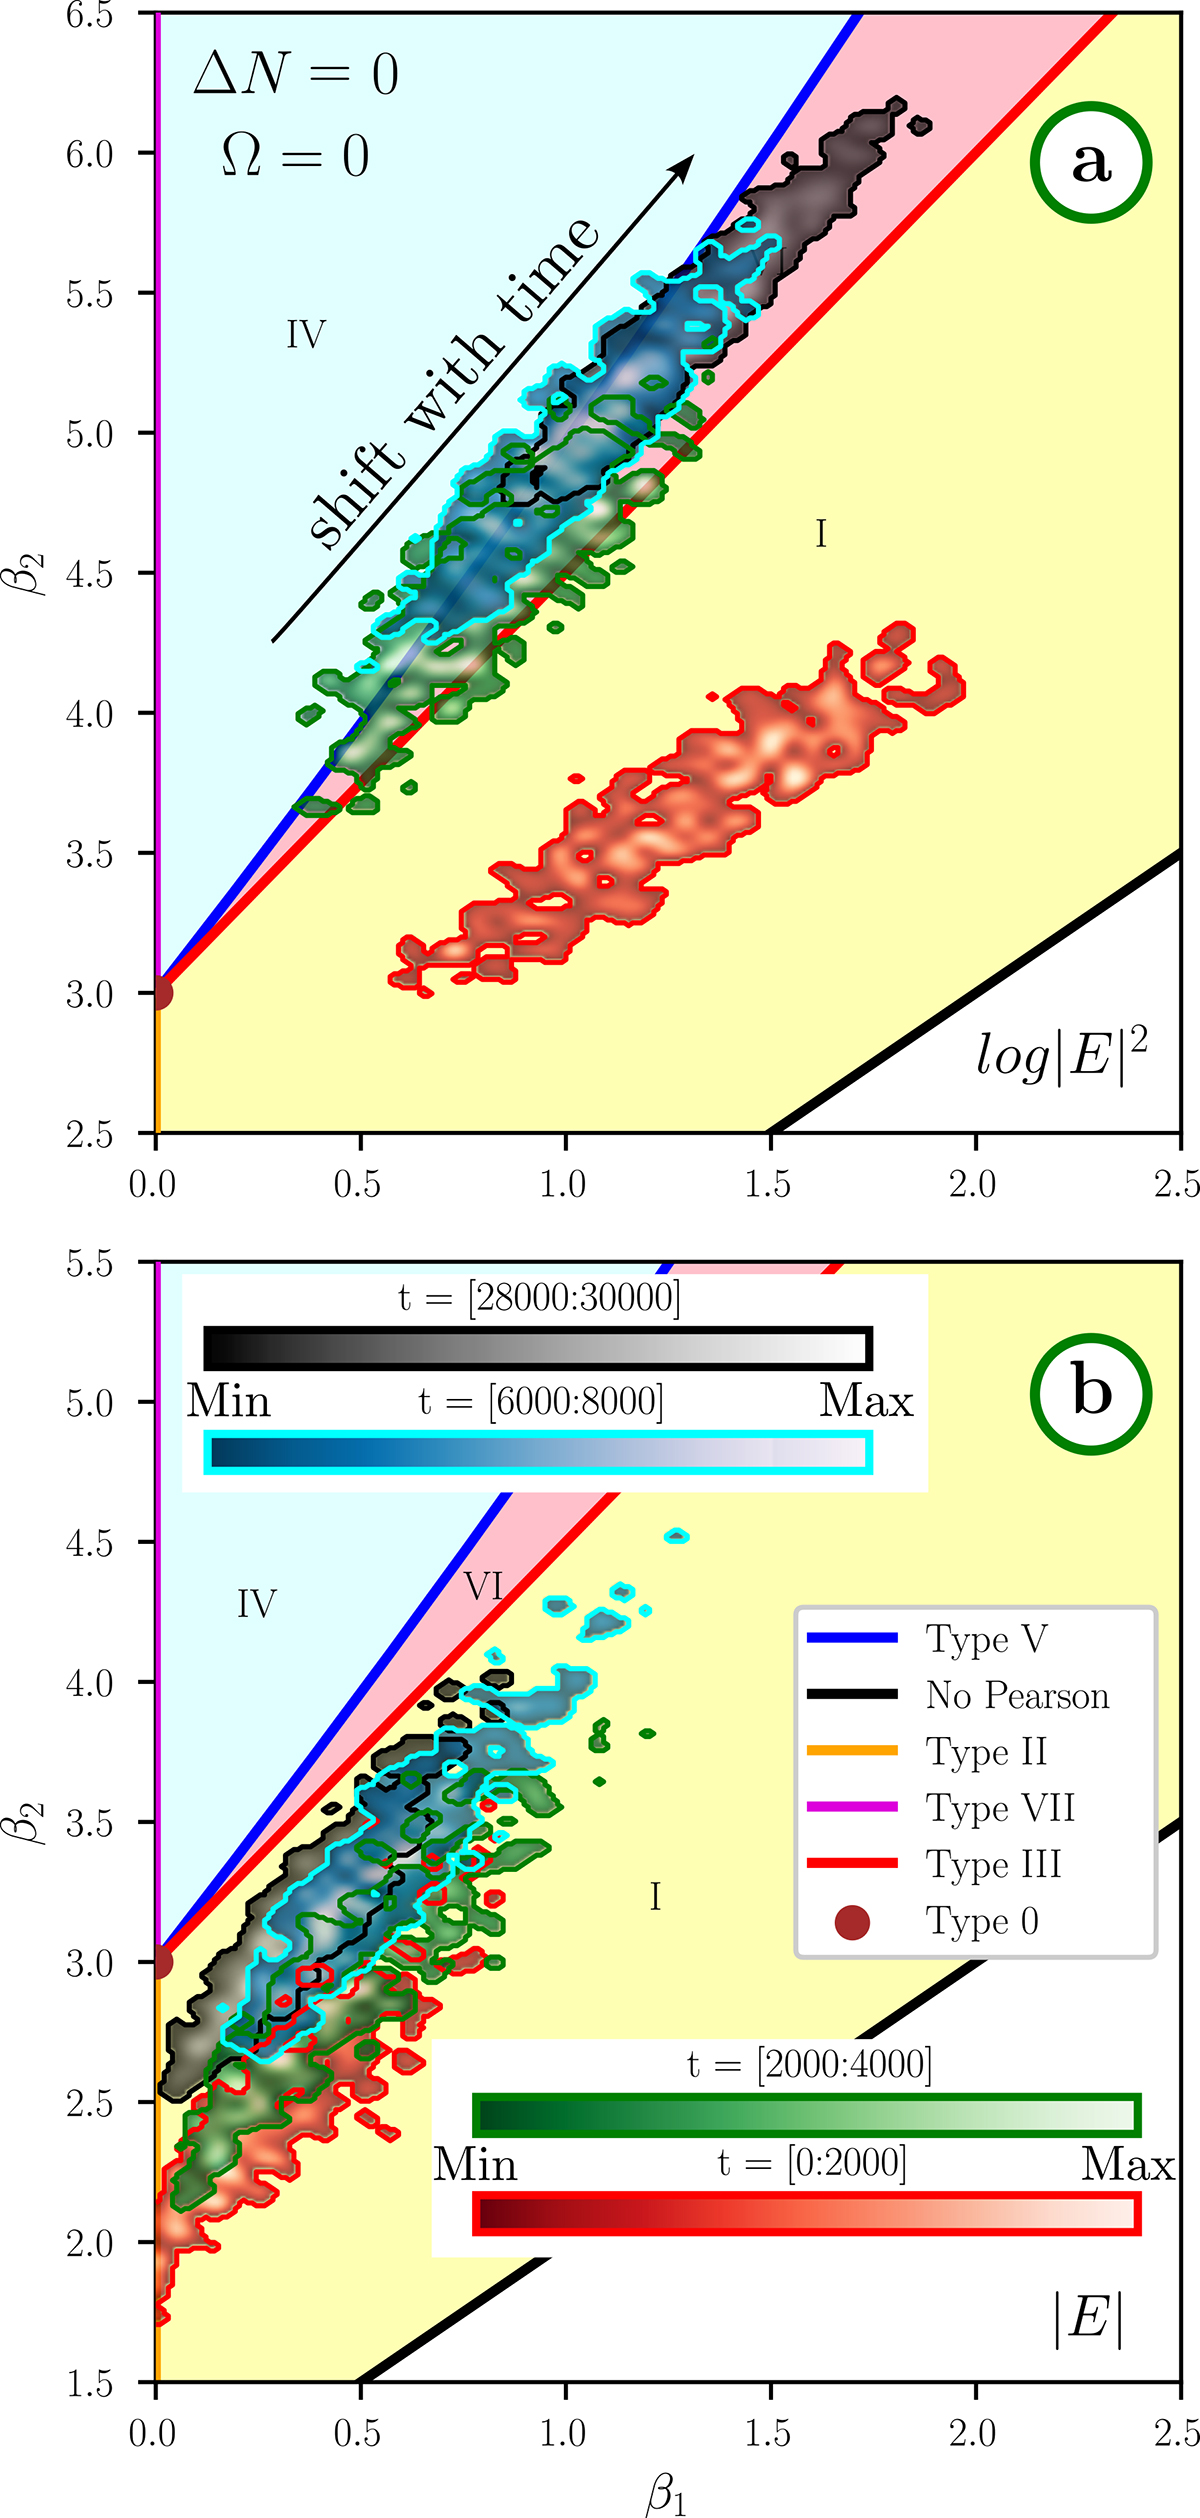
Uniform and unmagnetized plasma (ΔN = 0 and Ω = 0). We show β distributions of the PDFs of log|E|2 (a) and |E| (b) in the Pearson diagram (β1, β2), where β1 is the squared skewness and β2 is the kurtosis. The arrow indicates that as time advances, skewness and kurtosis increase. The legends in panel (b) list the time intervals [t0, t0 + ΔT] used to calculate the PDFs (![]() and indicate the different types of Pearson distributions; regions corresponding to Types I, IV, and VI are indicated in the map with roman numerals (see also Appendix A).
and indicate the different types of Pearson distributions; regions corresponding to Types I, IV, and VI are indicated in the map with roman numerals (see also Appendix A).
Current usage metrics show cumulative count of Article Views (full-text article views including HTML views, PDF and ePub downloads, according to the available data) and Abstracts Views on Vision4Press platform.
Data correspond to usage on the plateform after 2015. The current usage metrics is available 48-96 hours after online publication and is updated daily on week days.
Initial download of the metrics may take a while.