Fig. 8
Download original image
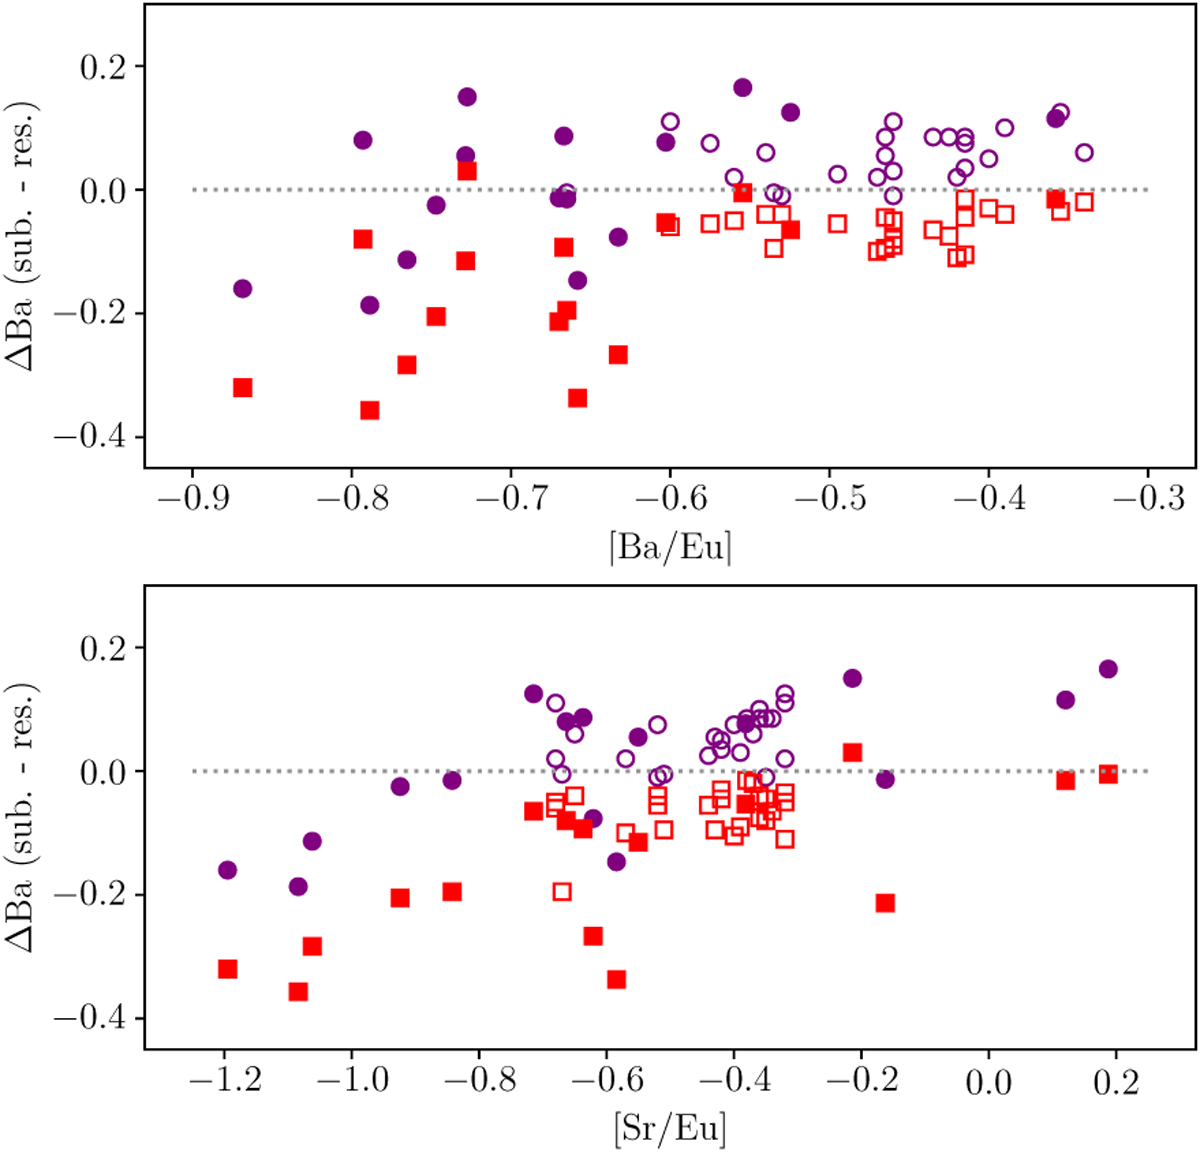
Abundance difference between the subordinate and the resonance lines for pure r-process (circles) and solar Ba isotope mixture (squares) in our sample stars (filled symbols) and data from MZ06 (open symbols). For comparison with MZ06, we plot our ΔBa (sub.-res.) computed with the r-process Ba isotope mixture from Arlandini et al. (1999).
Current usage metrics show cumulative count of Article Views (full-text article views including HTML views, PDF and ePub downloads, according to the available data) and Abstracts Views on Vision4Press platform.
Data correspond to usage on the plateform after 2015. The current usage metrics is available 48-96 hours after online publication and is updated daily on week days.
Initial download of the metrics may take a while.