| Issue |
A&A
Volume 695, March 2025
|
|
|---|---|---|
| Article Number | A94 | |
| Number of page(s) | 12 | |
| Section | Stellar atmospheres | |
| DOI | https://doi.org/10.1051/0004-6361/202346883 | |
| Published online | 11 March 2025 | |
Barium and europium abundances in high- and low-α halo stars
1
College of Physics, Hebei Normal University,
No.20 Road East. 2nd Ring South, Yuhua District,
050024
Shijiazhuang, China
2
College of Mathematics and Physics, Handan University,
No.530 Xueyuan Road, Hanshang District,
056005
Handan, China
3
Key Laboratory of Optical Astronomy, National Astronomical Observatories, Chinese Academy of Sciences,
20A Datun Road, Chaoyang District,
100012
Beijing, China
4
School of Astronomy and Space Science, University of Chinese Academy of Sciences,
Beijing
100049, China
5
School of Physics and Technology, Nantong University,
Nantong
226019, China
6
College of Physics and Electronic Information, Dezhou University,
Dezhou
253023, China
★ Corresponding authors; This email address is being protected from spambots. You need JavaScript enabled to view it.
; This email address is being protected from spambots. You need JavaScript enabled to view it.
Received:
12
May
2023
Accepted:
27
January
2025
Abstract
Context. Prior studies have found that there are two distinct halo populations with a clear separation in [α/Fe], known as the high-α and low-α populations. Certain other elements, such as [C/Fe], [O/Fe], and [Na/Fe], as well as [Cu/Fe], also show a clear distinction between the high- and low-α halo populations. However, the abundance ratios, such as [Li/Fe] and [Mn/Fe], are indistinguishable between these two halo populations.
Aims. This work is aim at determining the abundances of barium and europium for a sample of halo stars, including 29 high-α and 19 low-α halo stars, and to investigate the distributions of [Ba/Fe] and [Eu/Fe]. We also present the fraction of barium isotopes with an odd mass number (fodd) in the sample stars to estimate the relative contribution of the r- and s-processes to the abundance of Ba.
Methods. The abundance ratios of [Ba/Fe] and [Eu/Fe] were determined by the spectral synthesis method based on the high-resolution and high signal-to-noise ratio (S/N) spectra collected from the ESO/ST-ECF Science Archive of VLT/UVES and NOT/FIES spectrographs. Non-local thermodynamic equilibrium (NLTE) effects were also considered. The fodd value was estimated by fitting the profile of the Ba II resonance line at λ4554 Å.
Results. The NLTE effect is needed to be included to fully capture the line profiles for both Ba II and Eu II, however, the NLTE corrections for the barium and europium are different. For Ba, the NLTE corrections are negative compared to the results of thermodynamic equilibrium, except the star with lowest metallicity, and they become smaller with decreasing of [Fe/H]. For Eu, the NLTE corrections are positive and independent of stellar metallicity. It is found that both the abundances of [Ba/Fe] and [Eu/Fe] in the high-and low-α halo stars are mixed together. Although the [Eu/Ba] ratios cannot be distinguished clearly between the high- and low-α halo populations, stars with [Eu/Ba] ≥ 0.7 dex can only be found in the low-α population. Similar to [Eu/Ba], the ratios of fodd cannot be separated among the high- and low-α halo populations, although the stars with the highest fodd (≥0.4) can only be seen in the low-α stars with [Eu/Ba] ≥ 0.7 dex.
Conclusions. Our results indicate that both the [Ba/Fe] and [Eu/Fe] ratios are indistinguishable among the high- and low-α halo stars, while [Eu/Mg] is able to separate the two halo populations well. Combining the highest [Eu/Ba] and fodd ratios, as well as the lower [α/Fe] in some low-α halo stars, we can infer that the r-process is dominating in these low-α halo stars and they are likely to have been accreted from dwarf galaxies as proposed by previous studies.
Key words: line: formation / line: profiles / stars: abundances / Galaxy: halo
© The Authors 2025
 Open Access article, published by EDP Sciences, under the terms of the Creative Commons Attribution License (https://creativecommons.org/licenses/by/4.0), which permits unrestricted use, distribution, and reproduction in any medium, provided the original work is properly cited.
This article is published in open access under the Subscribe to Open model. This email address is being protected from spambots. You need JavaScript enabled to view it. to support open access publication.
1 Introduction
The stellar halo is arguably the component that contains the most useful information about the early evolutionary history of the Galaxy. The stellar atmospheres for some of the oldest metal-poor halo stars retain the composition of the gas from where they formed; therefore, the elemental abundance patterns in halo stars provide us with information about the chemical evolution and nucleosynthesis history of the early Galaxy (Helmi 2008).
According to the nucleosynthesis theory (Burbidge et al. 1957), chemical elements are classified in broad families depending on the nuclear process(es) and site(s) responsible for their production, such as the α-elements (e.g., O, Mg, Si, Ca, and Ti), light odd-Z elements (e.g., Na, Al, K, and Sc), iron-peak elements (e.g., Cr, Co, Ni, and Zn), and neutron-capture elements (e.g., Sr, Y, Ba, La, and Eu). The α-elements are synthesized by successive captures of α nuclei during the explosion of a massive star as a type II Supernovae (SNe), which occurs only a few million years (~ 107 years) after its formation. Iron-peak elements are produced partly by type II SNe and mainly by type Ia SNe. The type Ia SNe take place typically on a much longer timescale (108~109 years, Maoz et al. 2011).
The elements heavier than the iron-peak are created by neutron capture, through slow (s-) and rapid (r-) processes. These two neutron capture channels have very different sites. The s-process can take place when the neutron flux is low enough to allow all β decays to take place between successive neutron captures. These conditions are found in the envelopes of asymptotic giant branch (AGB) stars, during the thermally pulsing AGB phase of low-mass stars (2–4 M⊙, Travaglio et al. 1999). On the other hand, the r-process occurs when the neutron flux is sufficiently high to allow for rapid neutron captures. It is believed that the r-process must occur in environments such as explosions in type II supernovae, neutron stars or black hole mergers, accretion driven gravitational collapse, and so on (see details in the recent review by Cowan et al. 2021). However, the exact sites and conditions where the r-process occurs are still somewhat uncertain.
Due to the time delay in the bulk of iron production to α-elements, the abundance ratio [α/Fe] (note: here, α refers to the average abundance of Mg, Si, Ca, and Ti) is a good tracer to probe the star formation history of Galactic populations. For example, the disk of the Milky Way was found to have two chemically separate components: the thin disk and thick disk. The distribution of [α/Fe] versus [Fe/H] shows that the two disk populations overlap in metallicity, while having different [α/Fe] ratios, while the [α/Fe] of thick-disk stars have higher values than those of thin-disk ones (e.g., Fuhrmann 1998; Prochaska et al. 2000; Bensby et al. 2003; Adibekyan et al. 2012; Haywood et al. 2013). Similarly, studies also suggested that the halo contains two different components: the “low-α” halo and the “high-α” halo (Nissen & Schuster 1997, 2010; Fulbright 2002; Gratton et al. 2003; Haywood et al. 2013). Based on a detailed abundance analysis of a sample of 78 halo stars with 5200 < Teff < 6300 K and [Fe/H] > −1.6 dex, Nissen & Schuster (2010, hereafter, NS10) provided the first compelling evidence that the halo hosts two populations that are well separated in [α/Fe]; namely the “high-α” halo stars with a nearly constant [α/Fe] (≃0.30 dex), while the “low-α” halo stars have a declining [α/Fe] as a function of increasing metallicity. Subsequent studies found that the low- and high-α populations are also distinct in some other elemental abundance ratios, such as [Na/Fe], [C/Fe], [O/Fe], [Sc/Fe], [V/Fe], [Co/Fe], [Cu/Fe], [Zn/Fe], [Ba/Y], [Sc/Fe], [Zr/Fe], [La/Zr], [Y/Eu], and [Ba/Eu], however, they are indistinguishable from other chemical abundances, such as [Li/Fe], [Cr/Fe], [Mn/Fe], [La/Fe], [Nd/Fe], and [Ce/Fe] (Nissen & Schuster 2010; Nissen & Schuster 2011; Schuster et al. 2012; Nissen et al. 2014; Yan et al. 2016; Fishlock et al. 2017; Nissen et al. 2024). They argued that the low-α stars have the kinematics consistent with accretion from the satellite galaxies with a slower star formation rate than those of the high-α population which most likely formed in situ in the Galaxy. However, the origin and formation processes of the two stellar halo populations are still a matter of debate.
Recent observations of stars in Gaia Sausage (Belokurov et al. 2018; Helmi et al. 2018) and Sequoia (Myeong et al. 2019) support the hypothesis that the low-α stars are likely to have been accreted from dwarf spheroidal galaxies (e.g., Aguado et al. 2021; Matsuno et al. 2021). Helmi et al. (2018) and Haywood et al. (2018) found that the low-[Mg/Fe] stars in Gaia Sausage correspond to the group of halo stars with low-[α/Fe] ratios noted by NS10. Aguado et al. (2021) presented a detailed abundances of Sr, Y, Ba, and Eu for halo stars with −2.2 < [Fe/H] < −1.5 dex in Gaia Sausage and Sequoia, they showed a clear enhancement in Eu abundance ([Eu/Fe] ~ 0.6–0.7 dex) and low Ba abundances ([Ba/Fe] ≃ 0.0 dex), as well as a tight and flat [Ba/Eu] sequence with [Ba/Eu] = −0.7 dex (also see, Matsuno et al. 2021). The higher [Eu/Mg] and low [Mg/Fe] ratios have been measured in most dwarf galaxies; for example, Sagittarius (McWilliam et al. 2013), Fornax (Lemasle et al. 2014), and the Large Magellanic Cloude (LMC, Van der Swaelmen et al. 2013; Hasselquist et al. 2021).
Different heavy elements and different isotopes of one element are synthesized in different environments and on a range of timescales with different efficiencies in the s- and r-processes (McWilliam 1997; Sneden et al. 2008). For example, 81% of solar Ba is contributed by the s-process, 94% of solar Eu originates from the r-process, and Nd is produced almost equally by the r- and s-processes at the solar metallicity (Arlandini et al. 1999). Therefore, the [Eu/Ba] ratio is a good indicator to find clues about the origins and evolutions of stellar populations and the ratio of the contributions from the s- and r-processes to Ba abundance at the epoch when the star was formed (e.g., Mashonkina et al. 1999; Mashonkina & Gehren 2000,2001; Mashonkina et al. 2003; Fishlock et al. 2017; Matsuno et al. 2021; Aguado et al. 2021).
Based on the high-resolution and high signal-to-noise ratio spectra, Mashonkina & Gehren (2000, 2001) and Mashonkina et al. (2003) presented the Ba and Eu abundances for a sample stars of [Fe/H] from −2.20 to 0.25 dex with the NLTE effects considered, and found that the [Ba/Fe] ratios are approximately solar, while Eu is overabundant relative to both iron and barium with the mean values [Eu/Fe] = 0.62 dex and [Eu/Ba] = 0.64 dex in the halo stars, which means the dominance of the r-process elements synthesis during the formation of the halo population (see also Burris et al. 2000). They noted that the NLTE effects decrease the equivalent widths of the EU II lines compared to the LTE ones, and the departures from LTE are around 0.1 dex. However, the NLTE effect leads to stronger of the Ball lines compared to the LTE case at metallicity [Fe/H] > −2.0 dex and an opposite effect at more lower metallicities.
Another indicator for exploring the r- and s-process is the parity isotope fraction of barium, since barium has five isotopes whose production fractions in the r- and s-process are significantly different; even Ba isotopes are only synthesized in the s-process, whereas odd isotopes are produced in both processes (Arlandini et al. 1999; Sneden et al. 2008). In the solar system the ratio of r-process to s-process Ba is approximately 12:88 (Cameron 1982), and the fraction of Ba five isotopes is 134Ba: 135Ba: 136Ba: 137Ba: 138Ba = 2.4:6.6:7.9:11.2:71.7, with fodd1 = 0.18 (Lodders et al. 2009). For pure r-process production, the mixture of Ba isotopes is 135Ba:137Ba:138Ba = 24:22:54, corresponding to fodd= 0.46 (Travaglio et al. 1999). The profile of Ball resonance line at 4554Å is sensitive to the variation of the barium isotope mixture because the even isotopes are responsible for the core of the line, while the wings of the line are mainly influenced by the odd isotopes (Gallagher et al. 2010), therefore this makes it possible to determine fodd by fitting the line profile of Ba II at 4554 Å. The idea was proposed by Magain & Zhao (1993) and was used very rarely (e.g., Magain 1995; Arlandini et al. 1999; Mashonkina et al. 1999, 2003, 2008; Mashonkina & Gehren 2000; Mashonkina & Zhao 2006; Mashonkina & Belyaev 2019; Lambert & Allende Prieto 2002; Gallagher et al. 2010, 2015; Meng et al. 2016; Cescutti et al. 2021). Mashonkina & Gehren (2000) found that the [Eu/Ba] ratios in metal-poor halo stars are close to the pure r-process value of [Eu/Ba]r = 0.64dex with an odd-to-even Ba isotope ratios close to the pure r-process ratio 46:54, or fodd = 0.46. Similar results were presented by Mashonkina & Belyaev (2019); however, it was found that one of the four metal-poor stars ([Fe/H] < −2.0 dex) has a slightly lower fodd value of =0.27, which means that the heavy elements in halo stars are produced mainly in a r-process environment.
The NS10 sample provides a unique opportunity to investigate the abundances of neutron-capture elements in the low-and high-α populations, and to check whether the [Ba/Fe] and [Eu/Fe] ratios can be distinguished between the low- and high-α halo populations when the NLTE effects are included. in this paper, we derive the Ba and Eu abundances in both LTE and NLTE analysis of 48 metal-poor halo stars, including 29 high-α and 19 low-α halo stars, based on the high-resolution spectra obtained by ESO/UVES and NOT/FIES. This paper is organized as follows. The stellar parameters and observational data are described in Section 2. The atmospheric and atomic models are presented in Section 3. In Section 4, we present the results on the Ba and Eu abundances and their ratios, as well as the estimates of the odd to even Ba isotope ratios. The discussions are presented in Section 5. Finally, a summary is given in Section 6.
2 Observational data and stellar parameters
The majority of the halo stars in our sample are selected from Nissen & Schuster (2010). Since high resolution and high signal-to-noise ratio (S/N) spectra are required to determine the abundance of europium, only 40 halo stars from Nissen & Schuster (2010) have been selected. The other five halo stars are taken from Nissen et al. (2004) and Nissen et al. (2007). The effective temperature range of our sample stars is between 4900 K and 6500 K, and the metal abundance range is from −2.7 to −0.4 dex. The spectra for determining the barium and europium abundances have been downloaded from the European Southern Observatory ESO/ST-ECF Science Archive Facility2. The spectra from the ESO/VLT UVES spectrograph cover the wavelength range of 4800-6800 Å with a resolution of R ~ 55 000, and the S/N values of these spectra are from 250 to 500. The wavelength range of spectra from the FIbre fed Echelle Spectrograph (FIES) at the Nordic Optical Telescope is from 4000 to 7000 Å with a resolution R ~ 40 000, and the S/N values of the spectra are around 140-200. In addition, eight of the sample stars have been observed with the HARPS spectrograph of the 3.6-metre telescope at La Silla Observatory, and these spectra cover a wavelength range of 3800–6900 Å, with a resolution of R ~ 115 000.
We directly adopted the stellar parameters determined by Nissen & Schuster (2010) for 42 halo stars in our sample. A full description of the derivation of these parameters is given in a companion paper (Nissen & Schuster 2010). The stellar atmospheric parameters of the remaining six halo stars are adopted from Nissen et al. (2004), and Nissen et al. (2007), respectively. All of the parameters are presented in Table A.1.
3 Stellar atmospheric and atomic models
3.1 Stellar model atmospheres
The stellar model atmospheres are important for stellar spectra analysis. We adopted the MAFAGS-OS stellar atmosphere model, which was developed by Grupp (2004), and updated by Grupp et al. (2009).
3.2 Atomic models
3.2.1 Ba model
This work adopts the Bail atomic model established by Mashonkina et al. (1999), which contains all the levels with n ≤ 12 and l ≤ 4, and the fine structure of the 5d 2D and 6p 2P° terms have been considered. When n = 8, the difference in excitation energy between the nf and (n-1)ɡ levels is small, thus, these levels have been combined into a single level. The Ba model atom includes 35 bound levels of Ba II and the ground state of Ba III The energy levels are adopted from Roig & Tondello (1975). The Ba II transition probabilities from Wiese & Martin (1980) and Miles & Wiese (1969) were adopted (when possible) and supplemented with Kurucz (1994) or Lindgård & Nielson (1977).
3.2.2 Eu model
The Eu model atom was setup by Mashonkina (2000) and Mashonkina & Gehren (2000), which contains the energy levels with n ≤ 12 and l ≤ 4. This model includes the fine structure only for the 5d 9Do and 6p 9P terms. Thus, 32 bound levels of Eu II and the ground state of Eu III were included in the model atom, while the levels with the small energy differences were combined into a single level. The coupled radiative transfer and statistical equilibrium equations were solved with a revised version of the DETAIL code (Butler & Giddings 1995) based on the accelerated lambda iteration method (see Mashonkina et al. 2011, for details).
4 Results
4.1 The determination of barium and europium abundances
Not all elemental abundances can be reliably obtained from equivalent width measurements, and if the spectral lines are heavily mixed, we need to use a spectral synthesis method in order to obtain reliable abundances. We have obtained the abundances of the barium and europium elements using the spectral synthesis method, that is, by fitting the theoretical spectral line profiles to the observed ones. The Spectrum Investigation Utility (SIU) developed by Reetz (1999) based on the IDL environment is used to perform the line formation. We performed a normalization of the 1D spectra and the correction of the apparent velocities before fitting the spectra, both in the IDL environment using the SIU spectral processing software. When correcting for apparent velocity, a comparison with the solar spectrum was made. Three Ba II lines have been used for abundance analysis for our sample spectra, namely, Ba II 5853.68 Å, 6141.71 Å, and 6496.91 Å lines. We fit each line profile in a process that allowed for variations in macro-turbulence to ensure the best match between the synthetic and observed spectra. The final Ba abundance is the average value calculated from these three lines.
The NLTE effect of the two barium lines at 6141.71 Å and 6496.91 Å is large, and the magnitude of the NLTE correction varies both from star to star and from spectral line to line. In some cases, it can reach as high as 0.2 dex; therefore, it cannot be ignored. In our analysis, both the hyperfine structure (HFS) form Mashonkina & Gehren (2000) and the NLTE effects based on the Ba atomic model from Mashonkina et al. (1999) have been considered. The solar Ba abundance taken from Asplund et al. (2021) is used to calculate the barium abundances of halo stars (log ɛBa,⊙ = 2.23 dex). Examples of the line profile fit for Ba II are shown in Fig. 1. It can be seen from Fig. 1 that the NLTE effects are obvious for the three subordinate lines and the difference between NLTE and LTE can be seen in the line cores. The final barium abundances for the 48 stars are listed in Table A.3.
We compare our results with those of Nissen & Schuster (2011) in Fig. 2 and there are some deviations between the barium abundances obtained in our study and the results of Nissen & Schuster (2011). Our result is around 0.08 dex higher than that of Nissen & Schuster (2011), with a scatter of 0.04 dex.
In order to investigate the r-process nucleosynthesis, we also determine the abundances of europium. The Eu abundances are obtained from both the resonance line at λ4129 Å and the subordinate line at λ6495 Å if possible. Europium is mainly represented by two isotopes, 151Eu and 153Eu, and in this work we adopt 151Eu:153Eu=55:45. The HFS and NLTE effects of europium have been included during line fitting, and the Eu abundances relative to iron are presented in Table A.2. An example of the Eu II line profile fitting is given in Fig. 3 and the NLTE effects can be clearly seen. We use logɛEu,⊙ = 0.53 dex adopted from Mashonkina et al. (1999) and Mashonkina & Gehren (2000).
The uncertainty in our abundance ratios arises from errors due to stellar atmospheric parameters, and random errors from the S/N values of stellar spectra. The uncertainties of our [Ba/Fe] and [Eu/Fe] values have been estimated for three stars with different stellar atmospheric parameters; namely, HD 160693, G 20-15, and G 56-36. We derived the uncertainties of [Ba/Fe] and [Eu/Fe] by changing each parameter with their errors, and the results are given in Table 1. As discussed previously, our spectra have higher S/N values and the precision of the spectral synthesis method we used, the uncertainty on abundances can be neglected.
In Table A.3, we also give the detail [Ba/Fe] abundance ratios form the three subordinate lines and the mean [Ba/Fe] and standard values for both LTE and NLTE are also presented. The median standard deviation of [Ba/Fe] is 0.03 dex for all sample stars.
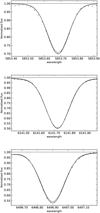 |
Fig. 1 Synthetic NLTE (continuous line) and LTE (dotted line) line profiles of Ba II compared to the observed UVES spectrum (bold dots) of HD 160693 ([Fe/H] = −1.20 dex). |
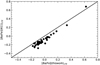 |
Fig. 2 Comparison of the [Ba/Fe ] in this work with those from Nissen & Schuster (2011) for the LTE results. |
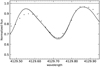 |
Fig. 3 Synthetic NLTE (continuous line) and LTE (dotted line) line profiles of Eu II compared to the observed UVES spectrum (bold dots) of HD 160693 ([Fe/H] = −1.20 dex). |
4.2 Determination of the fodd
The even Ba isotopes are mostly produced by the s-process, while the r-process contribution dominates the odd isotopes. Therefore, the fraction of barium isotopes with an odd mass number, fodd is an indicate of the relative contributions of the r- and s-process. The fodd value is derived from the requirement that the abundances determined from the resonance and subordinate lines be equal. The fodd is defined as
 (1)
(1)
We use fodd as a free parameter to fit the profile of the Ba II resonance line at λ4554 Å, with the abundance taken from the three subordinate lines and the proportion of odd isotopes being changed until the best fit is obtained.
We obtained the best odd-even isotope ratio by calculating the  value using the synthetic spectrum and the observed one. To find the best fit from a set of synthetic spectra to the observed ones, we calculated the values of reduced
  from Smith et al. (1998), which is defined as
 (2)
(2)
where Oi is the observed continuum-normalized flux, Si are the synthetic spectral points, ν is the number of degrees of freedom in the fit, and σi is the standard deviation of the data points defining the continuum of the observed spectrum. The values of σ are set by the S/N of the continua measured in roughly 1Å intervals on either side of the spectral line in question.
Having fixed the abundance of Ba derived from the three subordinate Ba II lines and varying the even-to-odd isotope ratios, we obtained the odd isotope fraction by fitting the Ba II resonance line at λ4554Å until a minimum value of  is obtained. Figure 4 shows the process for determining the fodd value through fitting the profile of the Ba II resonance line at 4554 Å for HD 160693. The best fitting result for the 4554 Å line and the residual (synthetic-observed profile) are illustrated in Fig. 4, where the adopted NLTE Ba abundance is [Ba/Fe] = −0.11, and fodd = 0.30 is used.
The  values corresponding to different ratios of parity for the star HD 160693 are given in Fig. 5 as a function of fodd. It can be seen that the
  –value corresponding to fodd = 0.30 is the smallest, and the parity ratio at this point is the best. The fraction of odd isotopes obtained from our sample stars is presented in Table A.2.
Estimating the error in fodd is complicated, as there are many factors that will affect the derived fodd value, such as the collisional damping constants log C6 of the Ba II subordinate and resonance lines, the stellar parameters, log ɡf value, and so on. The fitting of spectral line contours needs to be repeated for the change in each parameters. As an example, Table 2 presents the total errors in fodd for three stars. As shown in Table 2, the total error of fodd for the three stars is around 0.1; here, we take this mean error and standard deviation of fodd for the three stars as the average error for all our sample stars, which is 0.11±0.04.
Abundance errors of [Ba/Fe] and [Eu/Fe] from the uncertainties in stellar parameters.
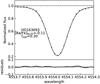 |
Fig. 4 Best-fitting result obtained with fodd = 0.30 for Ba II resonance line at 4554 Å of HD 160693. The filled circle is observed line profile, and the residual is plotted below. |
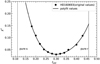 |
Fig. 5 χ2 fit for the 4554 Å line of HD 160693. The vertical dotted lines indicate the fodd,Ba of the solar pure s-process (left) and pure r-process (right), respectively. |
Uncertainties of fodd due to the errors of individual input parameters.
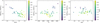 |
Fig. 6 The average NLTE corrections of Ba II three subordinate lines as functions of [Fe/H] (left panel), Teff (middle panel), and log ɡ (right panel). |
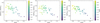 |
Fig. 7 The NLTE corrections of Ba II lines at λ 5853 Å (left panel), 6141 Å (middle panel) and 6496 Å (right panel) as functions of [Fe/H]. |
5 Discussion
5.1 The NLTE effects of Ba and Eu
There are obvious NLTE effects on the derived Ba abundances and the NLTE effects of the Ba II three subordinate lines are different. We considered the NLTE abundance correction ΔNLTE = [X/Fe]NLTE-[X/Fe]LTE (X in this case refers to the abundances of Ba and Eu). For our sample stars, it is found that the NLTE effects of Ba II lines are as large as 0.17 dex, with mean values of 0.04, 0.12, and 0.13 dex for the three subordinate lines at 5853, 6141, and 6496 Å, respectively. The difference in NLTE abundances between the three spectral lines does not exceed 0.1 dex. We found a negative NLTE correction for the Ba abundance and the barium abundance in the LTE case is overestimated by a maximum of about 0.15 dex.
We show the average NLTE corrections of Ba II three subordinate lines as functions of the stellar parameters, Teff, log ɡ, and [Fe/H] for our sample stars in Fig. 6. For stars with [Fe/H] > −2.0 dex, the NLTE corrections [Ba/Fe]NLTE−LTE are negative, and the NLTE effect of the Ba II lines becomes progressively larger as the metallicity increases. Mashonkina et al. (1999) also found that at [Fe/H] > −2.0dex, the NLTE leads to an enhancement of the Ba II line compared to the LTE case. In our results, the NLTE effect on the Ba II line gradually increases with decreasing metallicity, and there is no single relationship between the NLTE correction and the effective temperature or the surface gravity.
In Fig. 7, we plot the NLTE effects of Ba II lines at 5183,6141 and 6496 Å, respectively. It is obvious that the NLTE effects are larger for the 6141 and 6496 Å lines, while it is small for the Ba II line at λ 5853Å. The NLTE effect can reach as large as 0.2 dex for 6141 and 6496 Å lines, and it is less than 0.1 dex of the 5183 Å line for our investigated stars. Our NLTE effects are in good agreement with those of Mashonkina et al. (2003).
For europium, the NLTE effect is large with a minimum correction of 0.10 dex, and the maximum can reach as high as 0.18 dex. The NLTE effects as functions of the stellar parameters Teff, [Fe/H] and log ɡ are shown in Fig. 7. As shown in the Fig. 7, there is a tendance that the NLTE effects are larger for low surface gravity stars.
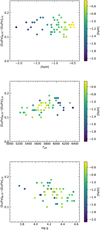 |
Fig. 8 NLTE corrections for Eu II line as functions of [Fe/H] (top panel), Teff (middle panel), and log ɡ (bottom panel). |
5.2 Ba and Eu abundances
In Fig. 9, we plot the [Ba/Fe] ratios as a function of [Fe/H]. In general, there is no clear boundary in our [Ba/Fe] ratio between the two populations of the same metallicity, which is consistent with the findings of Nissen & Schuster (2011). Although the high-α halo stars have higher average [Ba/Fe] ratios than those of low-α halo stars, the scatter is larger. The mean values of the [Ba/Fe] ratios are −0.11±0.14 dex and −0.08±0.17 dex for the low- and high-α stars, respectively. In addition, the mildly s-process rich star, G 96-20, has [Ba/Fe] = 0.54 dex and falls far above the upper limit of Fig. 9, and it also present a high Eu abundance of [Eu/Fe]=0.48 dex. In Fig. 9, the error bars of [Ba/Fe] ratios, which are the standard deviations of the line-to-line scatter for the NLTE abundances derived from the three subordinate Ba II lines are also shown.
The final [Eu/Fe] obtained from the NLTE calculation versus [Fe/H] is given in Fig. 10. We cannot see a clear boundary between the two populations in the whole metallicity range. However, for stars in the metallicity range of −1.5 < [Fe/H] < −1.0 dex, the low-α stars appear to have a higher [Eu/Fe] abundance compared to those of the high-a ones. The mean [Eu/Fe] values for the low- and high-α stars are 0.55±0.10 dex and 0.42±0.13 dex, respectively. Fishlock et al. (2017) noted this phenomenon and proposed that this separation is only observed at [Fe/H]~ −1.0 dex. They adopted the Kolmogorov-Smirnov test using data from their whole metallicity range and did not find a statistically significant separation between these two populations. We plot our LTE [Eu/Fe] results and those from Fishlock et al. (2017) in Fig. 11, similar situation can be found, which means that there is no clear separation between the high- and low-α populations for both sample stars. It should be noted that the NLTE effect for Eu is evident in our abundance determination and the [Eu/Fe] ratio increases from 0.2 dex at [Fe/H] ~ −0.75 dex, to 0.1 dex, as the metal abundance decreases.
We give the final [Eu/Ba] ratio as a function of [Fe/H] in Fig. 12, finding that the [Eu/Ba] ratio of low-α halo stars is higher than that of high-α halo stars. The [Eu/Ba] ratio of low-α halo stars ranges from 0.4 to 0.81 dex with a mean [Eu/Ba] of 0.68 dex. The solar system abundance ratio of Eu to Ba contributed by the r-process is [Eu/Ba]r = 0.70dex, according to Arlandini et al. (1999). The observed [Eu/Ba] ratios of seven low-α halo stars are higher than 0.70dex and two of them are close to 0.7 dex. Mashonkina et al. (2003) showed that in thick-disk and halo stars [Eu/Ba] lies in the range from 0.35 to 0.67 dex. Most of the [Eu/Ba] ratios of our sample halo stars are between 0.3 and 0.67 dex, and the results are in agreement with the trend of Mashonkina et al. (2003). From this result, it is clear that there is no clear distinction in [Eu/Ba] between high- and low-α halo stars, although some of the low-α stars show higher [Eu/Ba] values.
We present the [Ba/Mg] and [Eu/Mg] ratios as a function of [Fe/H] in Figs. 13 and 14, respectively. It is clear that except for the high Ba abundance star G 96-20, most low-α stars have higher [Ba/Mg] values. A more obvious phenomenon can be seen for [Eu/Mg]. This means that both the [Ba/Mg] and [Eu/Mg] ratios are separate for the two populations.
5.3 Discussion of fodd as an indicator of the r- and s-process nucleosynthesis
The even barium isotopes are produced mainly by the s-process, while the r-process contributes to the dominant odd isotopes, so fodd is a good indicator to explore the relative contribution of r-and s-process to the abundance of Ba. Both the [Eu/Ba] abundance ratio and the fraction of odd isotopes of Ba are sensitive to the relative contribution of the r-process synthesis, and we naturally expect that there is a correlation between them. In Fig. 11, we plot the fraction of the odd isotopes of Ba versus the [Eu/Ba] abundance ratios. It can be seen that the fraction of odd Ba isotopes roughly increases with increasing [Eu/Ba] ratio both for the low- and high-α halo stars. For a pure r-process, Travaglio et al. (1999) predicted that fodd,r should be 0.46. In Fig. 15, there are five low-α halo stars with fodd ~ 0.46 dex and [Eu/Ba] > 0.7 dex (G20−15, G 75−31, G87−13, G176−53, and HD 193901); thus, it means that both Eu and Ba in these five halo stars are produced by pure r-process. There are nine stars with fodd ≥ 0.4 dex, which implies that 83% of the barium in these stars is produced by the r-process if we adopt fodd,r = 0.46. Our result suggests that some low-α halo stars are very different from the high-α halo stars, whereby both the neutron-capture elements of Ba and Eu are synthesized by the r-process.
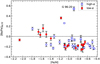 |
Fig. 9 [Ba/Fe] as a function of [Fe/H]. The open blue circles and filled red circles represent high- and low-α stars, and the error bars show the scatter between the Ba II lines. |
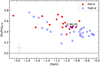 |
Fig. 10 [Eu/Fe] as a function of [Fe/H]. The symbols are the same as in Fig. 9, but the error bar is the mean error of [Eu/Fe] ratios form the three sample stars. |
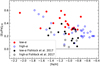 |
Fig. 11 [Eu/Fe] as a function of [Fe/H]. The data is from Fishlock et al. (2017) are also included. The open black circles and filled black circles represent high- and low-α stars form Fishlock et al. (2017), respectively. |
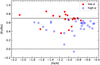 |
Fig. 12 [Eu/Ba] versus [Fe/H]. The solid line indicates [Eu/Ba]r = 0.70. The symbols are the same as in Fig. 9. |
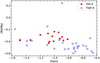 |
Fig. 13 [Ba/Mg] as a function of [Fe/H]. The open blue circles and filled red circles represent high- and low-α stars, respectively. |
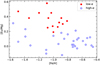 |
Fig. 14 [Eu/Mg] as a function of [Fe/H]. The open blue circles and filled red circles represent high- and low-α stars, respectively. |
6 Summary
In this paper, we determine the abundances of Eu and Ba for 48 halo stars by the spectral synthesis method. We derive the fraction of barium isotopes from the Ba II resonance line at λ 4554 Å. Based on the obtained [Eu/Ba] ratios and the fraction of barium isotopes, we discuss the relative contribution of r/s process nucleo-synthesis for high- and low-α halo stars. The main results of the study are as follows:
We found that the NLTE effects of barium lines are important and they are different for the three different Ba II lines. For our sample stars, the NLTE effect of barium lines is as large as 0.17 dex, with mean values of 0.04 dex, 0.12 dex, and 0.13 dex for the Ba II lines at 5853, 6141, and 6496 Å, respectively;
Foreuropium, the NLTE effect is obvious, the minimum correction is around 0.10 dex and it can reach a maximum of 0.18 dex for our sample stars;
The [Ba/Fe] and [Eu/Fe] ratios show no clear boundary between the low- and high-α stars of same metallicity for our sample, although the [Eu/Fe] ratios of low-α halo stars are generally higher than those of high-α stars;
Both the [Ba/Mg] and [Eu/Mg] ratios present clear separation between the low- and high-α stars, while the low-α stars have higher abundance ratios of [Ba/Mg] and [Eu/Mg] for our sample stars;
The fraction of odd Ba isotopes roughly increases with the increasing [Eu/Ba] ratio both for the low- and high-α halo stars, although most low-α halo stars tend to have higher [Eu/Ba] (>0.7 dex) and larger fodd (>0.4) values. This implies that the Ba of these low-α halo stars are mainly from the contribution of the r-process (>83%). Our result suggests that the low-α halo stars may come from close Galactic dwarf galaxies with high [Eu/Fe], while the high-α halo stars may be inner Galactic stars.
Of course, our stellar sample is small and the results obtained are inevitably subject to sample selection effects. Thus, a further validation of our conclusions will be required.
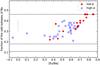 |
Fig. 15 Fraction of the odd isotopes of Ba versus [Eu/Ba]. The horizontal lines indicate the solar fraction of the odd isotopes (18%), and the values predicted by Arlandini et al. (1999) and Travaglio et al. (1999) for a pure r-process (46%) and pure s-process (11%), respectively. The symbols are the same as in Fig. 9. |
Acknowledgements
We thank the National Natural Science Foundation of China under grant Nos. 12090040/4, 12303027, and the support from the Key Research Program of the Chinese Academy of Sciences under grant No.XDPB09-02. We acknowledge the support from the 2m Chinese Space Station Telescope project. This work is supported by the Shandong Provincial Natural Science Foundation SZR2024QD242. This work based on observations made with the FIbre fed Echelle Spectrograph (FIES) at the Nordic Optical Telescope (NOT) on La Palma, and on data from the European Southern Observatory ESO/ST-ECF Science Archive Facility (programs 71.B-0529, 69.D-0679, 72.B-0529, 65.L-0507, 082.B-0610, 80.D-0347, 90.B-0605, 37-003, 38-013.
Appendix A Additional Tables
Stellar atmospheric parameters of our sample stars.
Detailed stellar Ba and Eu abundances, as well as the corresponding [Eu/Ba] ratios and the fraction of the odd isotopes of Ba.
Detailed LTE and NLTE Ba abundance ratios from three subordinate lines, and mean and standard deviation values.
References
- Adibekyan, V. Z., Sousa, S., Santos, N., et al. 2012, A&A, 545, A32 [NASA ADS] [CrossRef] [EDP Sciences] [Google Scholar]
- Aguado, D. S., Belokurov, V., Myeong, G. C., et al. 2021, ApJ, 908, L8 [NASA ADS] [CrossRef] [Google Scholar]
- Arlandini, C., Käppeler, F., Wisshak, K., et al. 1999, ApJ, 525, 886 [Google Scholar]
- Asplund, M., Amarsi, A. M., & Grevesse, N. 2021, A&A, 653, A141 [NASA ADS] [CrossRef] [EDP Sciences] [Google Scholar]
- Belokurov, V., Erkal, D., Evans, N. W., Koposov, S. E., & Deason, A. J. 2018, MNRAS, 478, 611 [Google Scholar]
- Bensby, T., Feltzing, S., & Lundström, I. 2003, A&A, 410, 527 [CrossRef] [EDP Sciences] [Google Scholar]
- Burbidge, E. M., Burbidge, G. R., Fowler, W. A., & Hoyle, F. 1957, Rev. Mod. Phys., 29, 547 [NASA ADS] [CrossRef] [Google Scholar]
- Burris, D. L., Pilachowski, C. A., Armandroff, T. E., et al. 2000, ApJ, 544, 302 [Google Scholar]
- Butler, K., & Giddings, J. 1995, in Newsletter on the Analysis of Astronomical Spectra, 9, University of London [Google Scholar]
- Cameron, A. G. W. 1982, Ap&SS, 82, 123 [NASA ADS] [CrossRef] [Google Scholar]
- Cescutti, G., Morossi, C., Franchini, M., et al. 2021, A&A, 654, A164 [NASA ADS] [CrossRef] [EDP Sciences] [Google Scholar]
- Cowan, J. J., Sneden, C., Lawler, J. E., et al. 2021, Rev. Mod. Phys., 93, 015002 [Google Scholar]
- Fishlock, C. K., Yong, D., Karakas, A. I., et al. 2017, MNRAS, 466, 4672 [NASA ADS] [Google Scholar]
- Fuhrmann, K. 1998, A&A, 338, 161 [NASA ADS] [Google Scholar]
- Fulbright, J. P. 2002, AJ, 123, 404 [NASA ADS] [CrossRef] [Google Scholar]
- Gallagher, A., Ryan, S. G., Pérez, A. G., & Aoki, W. 2010, A&A, 523, A24 [NASA ADS] [CrossRef] [EDP Sciences] [Google Scholar]
- Gallagher, A. J., Ludwig, H. G., Ryan, S. G., & Aoki, W. 2015, A&A, 579, A94 [NASA ADS] [CrossRef] [EDP Sciences] [Google Scholar]
- Gratton, R. G., Carretta, E., Claudi, R., Lucatello, S., & Barbieri, M. 2003, A&A, 404, 187 [NASA ADS] [CrossRef] [EDP Sciences] [Google Scholar]
- Grupp, F. 2004, A&A, 420, 289 [NASA ADS] [CrossRef] [EDP Sciences] [Google Scholar]
- Grupp, F., Kurucz, R. L., & Tan, K. 2009, A&A, 503, 177 [NASA ADS] [CrossRef] [EDP Sciences] [Google Scholar]
- Hasselquist, S., Hayes, C. R., Lian, J., et al. 2021, ApJ, 923, 172 [NASA ADS] [CrossRef] [Google Scholar]
- Haywood, M., Di Matteo, P., Lehnert, M. D., Katz, D., & Gómez, A. 2013, A&A, 560, A109 [NASA ADS] [CrossRef] [EDP Sciences] [Google Scholar]
- Haywood, M., Di Matteo, P., Lehnert, M. D., et al. 2018, ApJ, 863, 113 [Google Scholar]
- Helmi, A. 2008, A&A Rev., 15, 145 [NASA ADS] [CrossRef] [Google Scholar]
- Helmi, A., Babusiaux, C., Koppelman, H. H., et al. 2018, Nature, 563, 85 [Google Scholar]
- Kurucz, R. L. 1994, in IAU Colloq. 146: Molecules in the Stellar Environment, 428, ed. U. G. Jorgensen, 282 [NASA ADS] [CrossRef] [Google Scholar]
- Lambert, D. L., & Allende Prieto, C. 2002, MNRAS, 335, 325 [Google Scholar]
- Lemasle, B., de Boer, T. J. L., Hill, V., et al. 2014, A&A, 572, A88 [NASA ADS] [CrossRef] [EDP Sciences] [Google Scholar]
- Lindgård, A., & Nielson, S. E. 1977, At. Data Nucl. Data Tables, 19, 533 [CrossRef] [Google Scholar]
- Lodders, K., Palme, H., & Gail, H. P. 2009, Solar System, Landolt-Börnstein, Group VI Astronomy and Astrophysics, 4B, 712 [CrossRef] [Google Scholar]
- Magain, P. 1995, A&A, 297, 686 [NASA ADS] [Google Scholar]
- Magain, P., & Zhao, G. 1993, A&A, 268, L27 [NASA ADS] [Google Scholar]
- Maoz, D., Mannucci, F., Li, W., et al. 2011, MNRAS, 412, 1508 [Google Scholar]
- Mashonkina, L. I. 2000, Astron. Rep., 44, 558 [NASA ADS] [CrossRef] [Google Scholar]
- Mashonkina, L. I., & Belyaev, A. K. 2019, Astron. Lett., 45, 341 [NASA ADS] [CrossRef] [Google Scholar]
- Mashonkina, L., & Gehren, T. 2000, A&A, 364, 249 [NASA ADS] [Google Scholar]
- Mashonkina, L., & Gehren, T. 2001, A&A, 376, 232 [CrossRef] [EDP Sciences] [Google Scholar]
- Mashonkina, L., & Zhao, G. 2006, A&A, 456, 313 [NASA ADS] [CrossRef] [EDP Sciences] [Google Scholar]
- Mashonkina, L., Gehren, T., & Bikmaev, I. 1999, A&A, 343, 519 [NASA ADS] [Google Scholar]
- Mashonkina, L., Gehren, T., Travaglio, C., & Borkova, T. 2003, A&A, 397, 275 [CrossRef] [EDP Sciences] [Google Scholar]
- Mashonkina, L., Zhao, G., Gehren, T., et al. 2008, A&A, 478, 529 [NASA ADS] [CrossRef] [EDP Sciences] [Google Scholar]
- Mashonkina, L., Gehren, T., Shi, J. R., Korn, A. J., & Grupp, F. 2011, A&A, 528, A87 [NASA ADS] [CrossRef] [EDP Sciences] [Google Scholar]
- Matsuno, T., Hirai, Y., Tarumi, Y., et al. 2021, A&A, 650, A110 [NASA ADS] [CrossRef] [EDP Sciences] [Google Scholar]
- McWilliam, A. 1997, ARA&A, 35, 503 [NASA ADS] [CrossRef] [Google Scholar]
- McWilliam, A., Wallerstein, G., & Mottini, M. 2013, ApJ, 778, 149 [NASA ADS] [CrossRef] [Google Scholar]
- Meng, X., Cui, W., Shi, J., et al. 2016, A&A, 593, A62 [NASA ADS] [CrossRef] [EDP Sciences] [Google Scholar]
- Miles, B. M., & Wiese, W. L. 1969, Atomic Data, 1, 1 [NASA ADS] [CrossRef] [Google Scholar]
- Myeong, G. C., Vasiliev, E., Iorio, G., Evans, N. W., & Belokurov, V. 2019, MNRAS, 488, 1235 [Google Scholar]
- Nissen, P., & Schuster, W. 1997, A&A, 326, 751 [NASA ADS] [Google Scholar]
- Nissen, P. E., & Schuster, W. J. 2010, A&A, 511, L10 [NASA ADS] [CrossRef] [EDP Sciences] [Google Scholar]
- Nissen, P. E., & Schuster, W. J. 2011, A&A, 530, A15 [NASA ADS] [CrossRef] [EDP Sciences] [Google Scholar]
- Nissen, P. E., Chen, Y. Q., Asplund, M., & Pettini, M. 2004, A&A, 415, 993 [NASA ADS] [CrossRef] [EDP Sciences] [Google Scholar]
- Nissen, P. E., Akerman, C., Asplund, M., et al. 2007, A&A, 469, 319 [NASA ADS] [CrossRef] [EDP Sciences] [Google Scholar]
- Nissen, P., Chen, Y., Carigi, L., Schuster, W., & Zhao, G. 2014, A&A, 568, A25 [NASA ADS] [CrossRef] [EDP Sciences] [Google Scholar]
- Nissen, P. E., Amarsi, A. M., Skúladóttir, Á., & Schuster, W. J. 2024, A&A, 682, A116 [NASA ADS] [CrossRef] [EDP Sciences] [Google Scholar]
- Prochaska, J. X., Naumov, S. O., Carney, B. W., McWilliam, A., & Wolfe, A. M. 2000, AJ, 120, 2513 [Google Scholar]
- Reetz, J. 1999, PhD thesis, Ludwig-Maximilians-Universität München, Germany [Google Scholar]
- Roig, R. A., & Tondello, G. 1975, J. Opt. Soc. Am., 65, 829 [NASA ADS] [CrossRef] [Google Scholar]
- Schuster, W. J., Moreno, E., Nissen, P. E., & Pichardo, B. 2012, A&A, 538, A21 [NASA ADS] [CrossRef] [EDP Sciences] [Google Scholar]
- Smith, V. V., Lambert, D. L., & Nissen, P. E. 1998, ApJ, 506, 405 [Google Scholar]
- Sneden, C., Cowan, J. J., & Gallino, R. 2008, ARA&A, 46, 241 [Google Scholar]
- Travaglio, C., Galli, D., Gallino, R., et al. 1999, ApJ, 521, 691 [NASA ADS] [CrossRef] [Google Scholar]
- Van der Swaelmen, M., Hill, V., Primas, F., & Cole, A. A. 2013, A&A, 560, A44 [NASA ADS] [CrossRef] [EDP Sciences] [Google Scholar]
- Wiese, W. L., & Martin, G. A. 1980, Wavelengths and transition probabilities for atoms and atomic ions: Part 2. Transition probabilities, 68 [Google Scholar]
- Yan, H. L., Shi, J. R., Nissen, P. E., & Zhao, G. 2016, A&A, 585, A102 [NASA ADS] [CrossRef] [EDP Sciences] [Google Scholar]
fodd≡[N(135Ba)+N(137Ba)]/N(Ba).
All Tables
Abundance errors of [Ba/Fe] and [Eu/Fe] from the uncertainties in stellar parameters.
Detailed stellar Ba and Eu abundances, as well as the corresponding [Eu/Ba] ratios and the fraction of the odd isotopes of Ba.
Detailed LTE and NLTE Ba abundance ratios from three subordinate lines, and mean and standard deviation values.
All Figures
|
Fig. 1 Synthetic NLTE (continuous line) and LTE (dotted line) line profiles of Ba II compared to the observed UVES spectrum (bold dots) of HD 160693 ([Fe/H] = −1.20 dex). |
| In the text | |
|
Fig. 2 Comparison of the [Ba/Fe ] in this work with those from Nissen & Schuster (2011) for the LTE results. |
| In the text | |
|
Fig. 3 Synthetic NLTE (continuous line) and LTE (dotted line) line profiles of Eu II compared to the observed UVES spectrum (bold dots) of HD 160693 ([Fe/H] = −1.20 dex). |
| In the text | |
|
Fig. 4 Best-fitting result obtained with fodd = 0.30 for Ba II resonance line at 4554 Å of HD 160693. The filled circle is observed line profile, and the residual is plotted below. |
| In the text | |
|
Fig. 5 χ2 fit for the 4554 Å line of HD 160693. The vertical dotted lines indicate the fodd,Ba of the solar pure s-process (left) and pure r-process (right), respectively. |
| In the text | |
|
Fig. 6 The average NLTE corrections of Ba II three subordinate lines as functions of [Fe/H] (left panel), Teff (middle panel), and log ɡ (right panel). |
| In the text | |
|
Fig. 7 The NLTE corrections of Ba II lines at λ 5853 Å (left panel), 6141 Å (middle panel) and 6496 Å (right panel) as functions of [Fe/H]. |
| In the text | |
|
Fig. 8 NLTE corrections for Eu II line as functions of [Fe/H] (top panel), Teff (middle panel), and log ɡ (bottom panel). |
| In the text | |
|
Fig. 9 [Ba/Fe] as a function of [Fe/H]. The open blue circles and filled red circles represent high- and low-α stars, and the error bars show the scatter between the Ba II lines. |
| In the text | |
|
Fig. 10 [Eu/Fe] as a function of [Fe/H]. The symbols are the same as in Fig. 9, but the error bar is the mean error of [Eu/Fe] ratios form the three sample stars. |
| In the text | |
|
Fig. 11 [Eu/Fe] as a function of [Fe/H]. The data is from Fishlock et al. (2017) are also included. The open black circles and filled black circles represent high- and low-α stars form Fishlock et al. (2017), respectively. |
| In the text | |
|
Fig. 12 [Eu/Ba] versus [Fe/H]. The solid line indicates [Eu/Ba]r = 0.70. The symbols are the same as in Fig. 9. |
| In the text | |
|
Fig. 13 [Ba/Mg] as a function of [Fe/H]. The open blue circles and filled red circles represent high- and low-α stars, respectively. |
| In the text | |
|
Fig. 14 [Eu/Mg] as a function of [Fe/H]. The open blue circles and filled red circles represent high- and low-α stars, respectively. |
| In the text | |
|
Fig. 15 Fraction of the odd isotopes of Ba versus [Eu/Ba]. The horizontal lines indicate the solar fraction of the odd isotopes (18%), and the values predicted by Arlandini et al. (1999) and Travaglio et al. (1999) for a pure r-process (46%) and pure s-process (11%), respectively. The symbols are the same as in Fig. 9. |
| In the text | |
Current usage metrics show cumulative count of Article Views (full-text article views including HTML views, PDF and ePub downloads, according to the available data) and Abstracts Views on Vision4Press platform.
Data correspond to usage on the plateform after 2015. The current usage metrics is available 48-96 hours after online publication and is updated daily on week days.
Initial download of the metrics may take a while.