Open Access
Fig. 11
Download original image
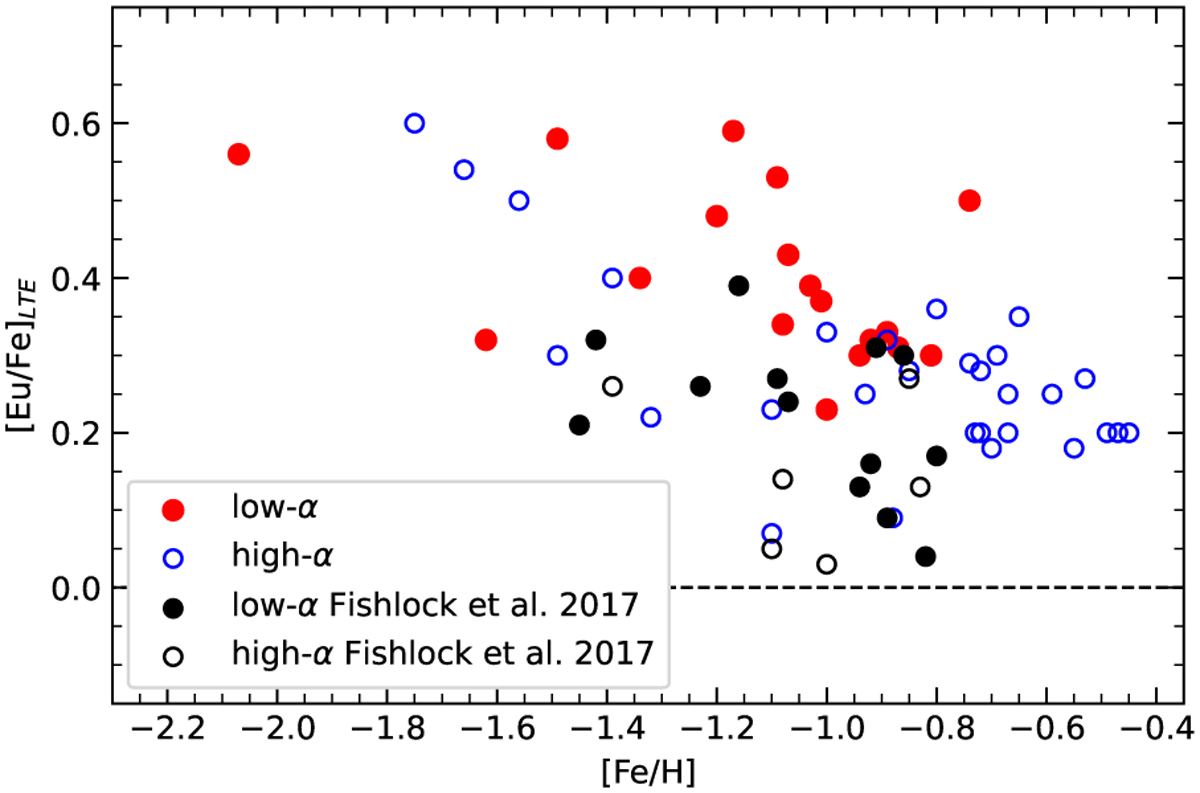
[Eu/Fe] as a function of [Fe/H]. The data is from Fishlock et al. (2017) are also included. The open black circles and filled black circles represent high- and low-α stars form Fishlock et al. (2017), respectively.
Current usage metrics show cumulative count of Article Views (full-text article views including HTML views, PDF and ePub downloads, according to the available data) and Abstracts Views on Vision4Press platform.
Data correspond to usage on the plateform after 2015. The current usage metrics is available 48-96 hours after online publication and is updated daily on week days.
Initial download of the metrics may take a while.