Fig. 6
Download original image
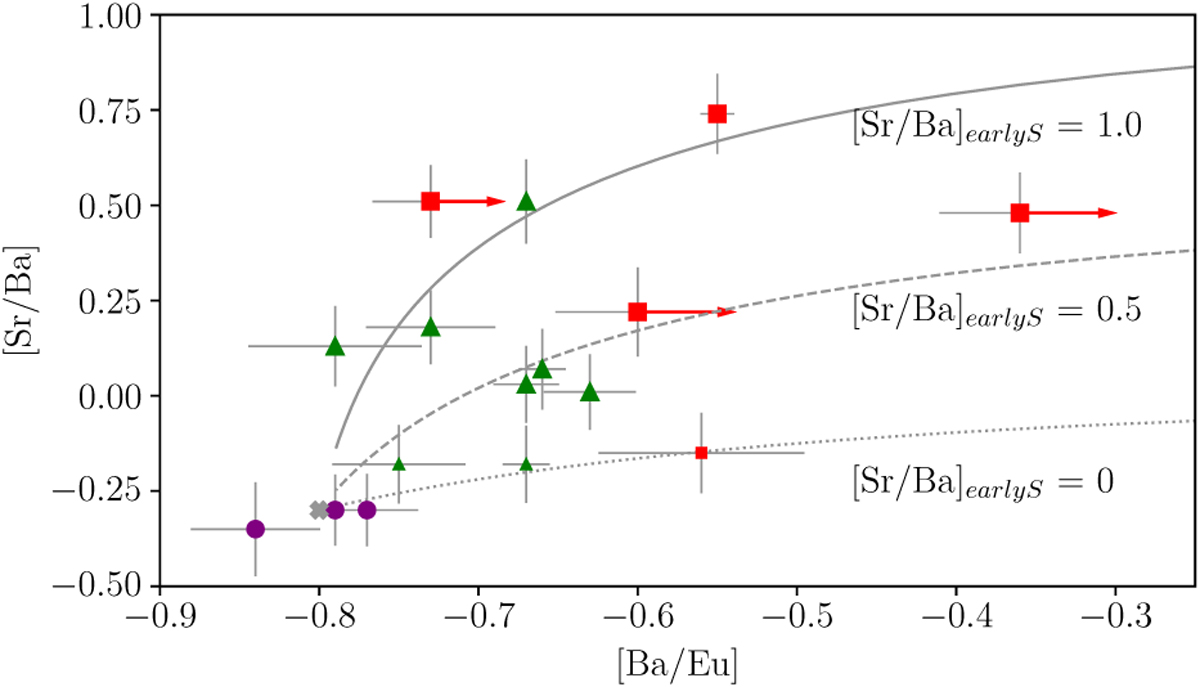
Abundance ratios in r- II (circles), r- I (triangles) stars, and sample stars with normal [Eu/Fe] < −0.3 (squares). Smaller symbols represent stars with [Fe/H] > −2.5. An x symbol indicates a pure r-process ratio derived from average abundances in r- II sample stars. Different lines show abundance ratios calculated for mixtures of r-process and s-process with varying [Sr/Ba]earlyS. See the legend for designations.
Current usage metrics show cumulative count of Article Views (full-text article views including HTML views, PDF and ePub downloads, according to the available data) and Abstracts Views on Vision4Press platform.
Data correspond to usage on the plateform after 2015. The current usage metrics is available 48-96 hours after online publication and is updated daily on week days.
Initial download of the metrics may take a while.