Fig. 5
Download original image
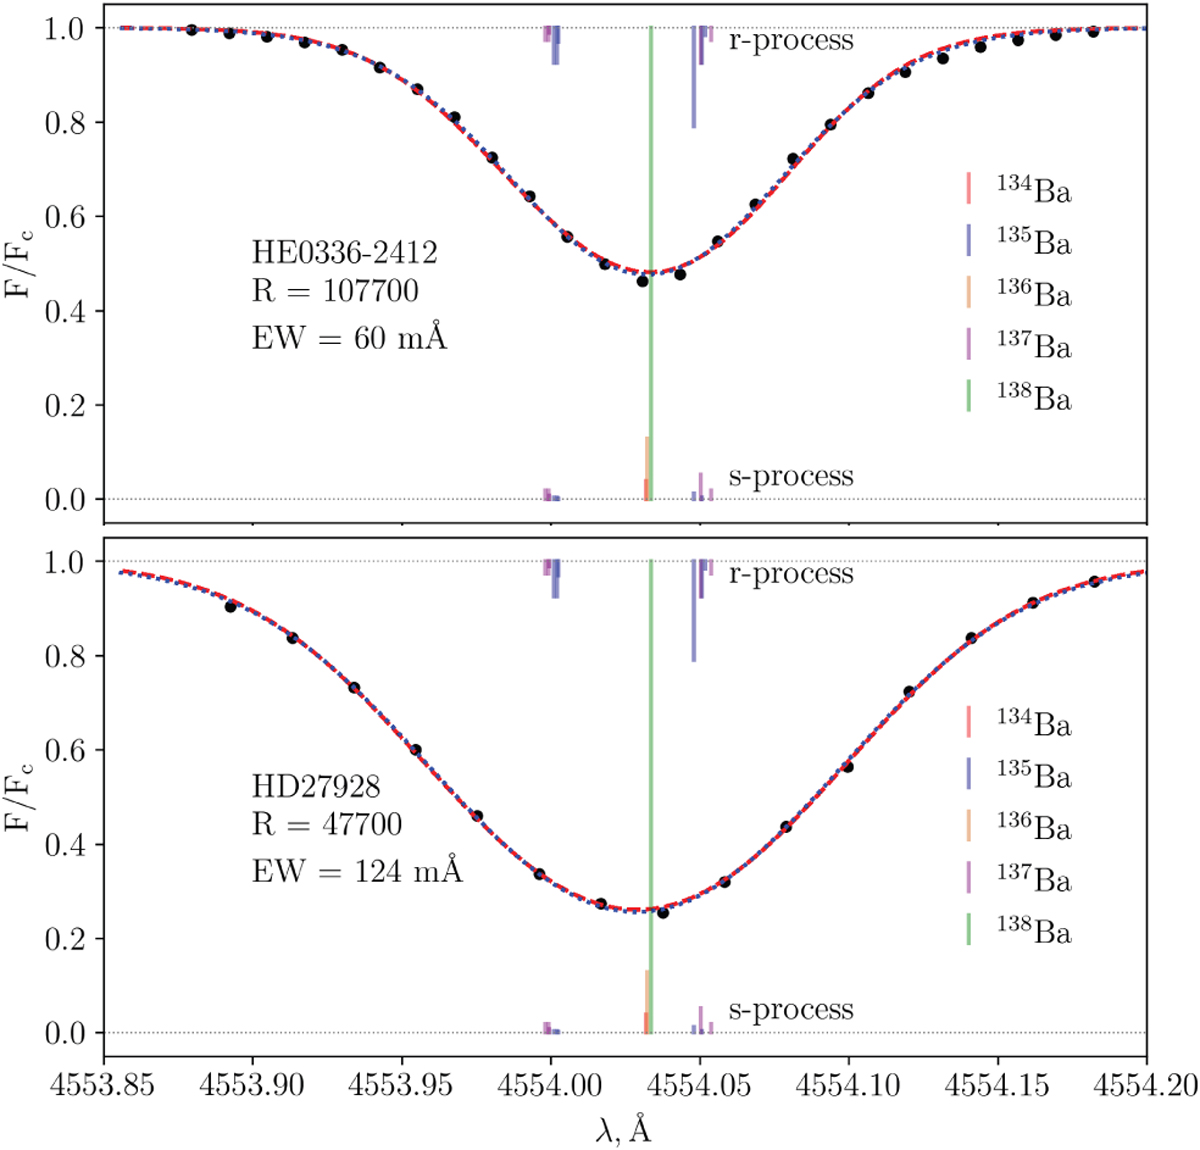
Top panel: Ba II 4554 Å line profile in the observed spectrum (circles) of HE0336–2412 (CES0338–2402). Synthetic best-fit NLTE spectra, derived using pure r-process (dashed line) and pure s-process (dotted line) Ba isotope mixtures are almost indistinguishable, demonstrating that a reasonable fit can be achieved with any adopted isotope ratio. Vertical dashes show the relative contribution of different Ba isotopes to the r-process and s-process; see legend for designations. Bottom panel: Same as the top panel for HD 27928 (CES0422–3715).
Current usage metrics show cumulative count of Article Views (full-text article views including HTML views, PDF and ePub downloads, according to the available data) and Abstracts Views on Vision4Press platform.
Data correspond to usage on the plateform after 2015. The current usage metrics is available 48-96 hours after online publication and is updated daily on week days.
Initial download of the metrics may take a while.