Open Access
Fig. 11
Download original image
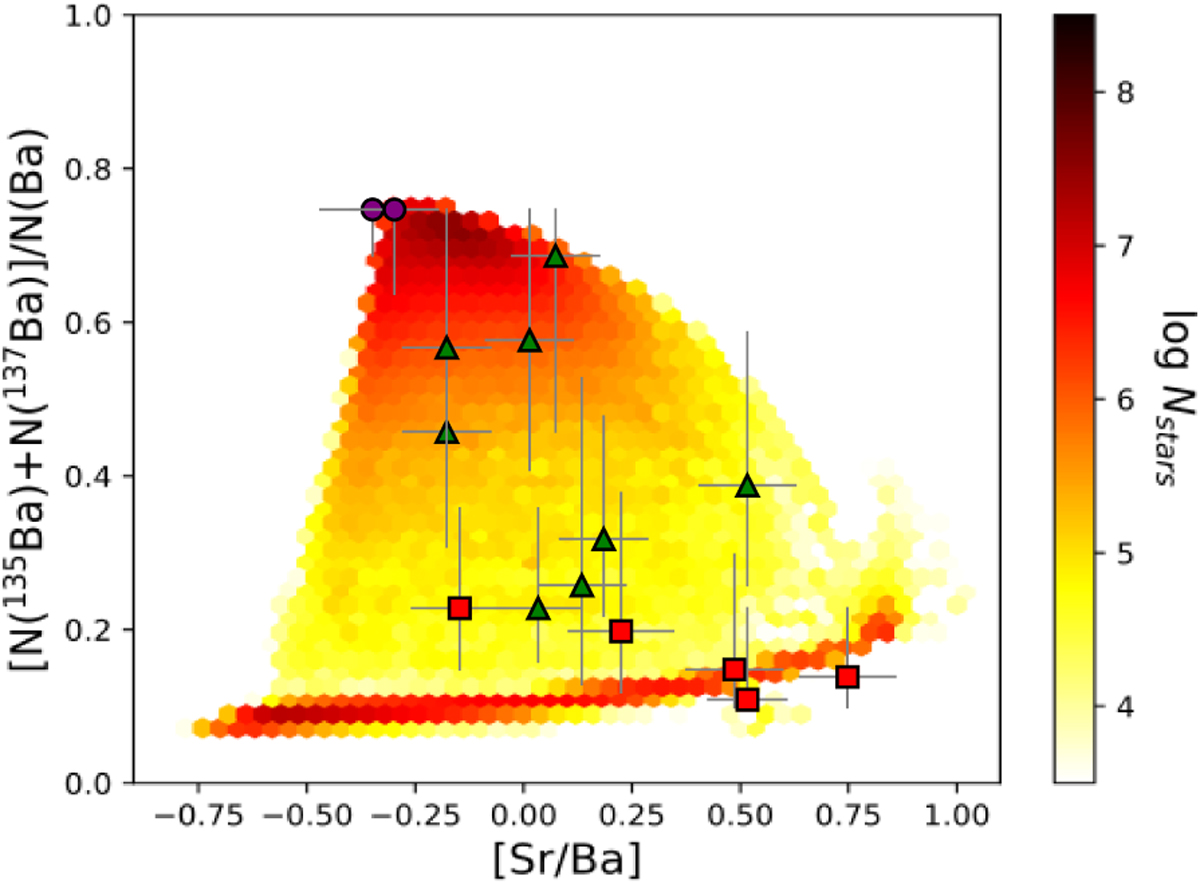
Comparison of the derived fraction of odd Ba isotopes with the simulated data for long-living stars in the chemical evolution model. Designations are the same as in Fig. 6. Colour bar indicates the predicted number of stars in each area of the diagram.
Current usage metrics show cumulative count of Article Views (full-text article views including HTML views, PDF and ePub downloads, according to the available data) and Abstracts Views on Vision4Press platform.
Data correspond to usage on the plateform after 2015. The current usage metrics is available 48-96 hours after online publication and is updated daily on week days.
Initial download of the metrics may take a while.