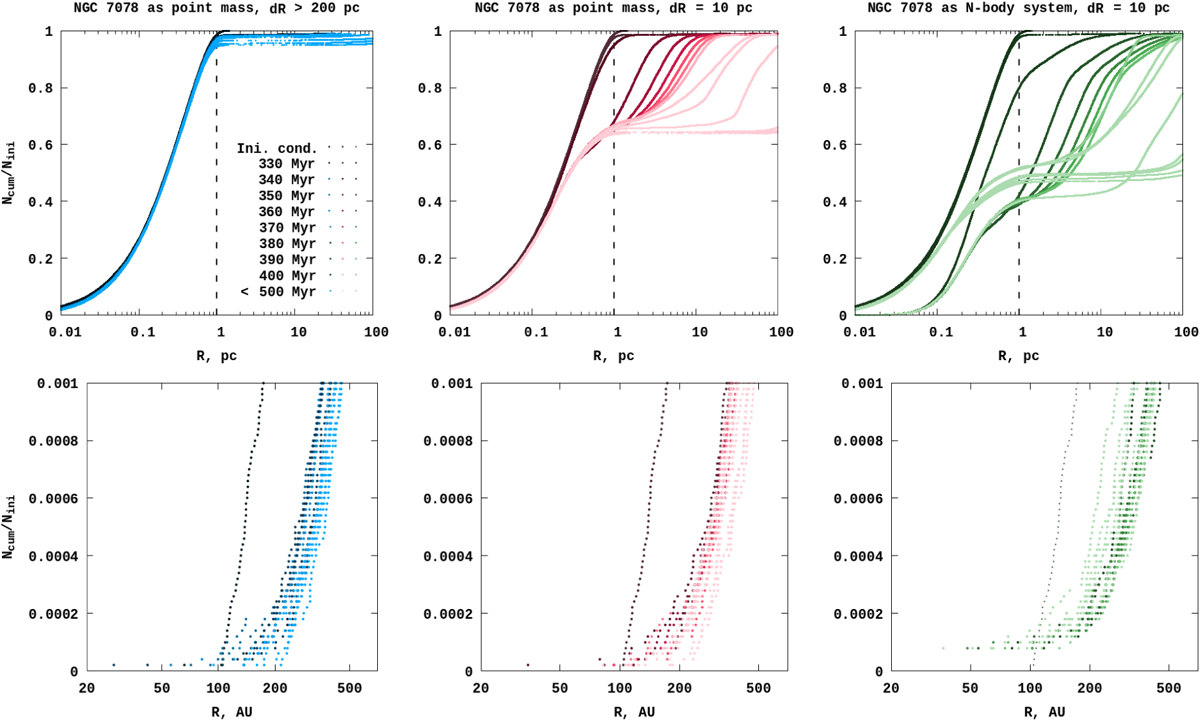
Fig. 12
Download original image
Cumulative normalised Oort particle distributions at different times as a function of relative distance from the Sun. The left and middle panels show the particle distributions when NGC 7078 is integrated as a single physical point mass, with passages of more than 200 and 10 pc, respectively. The right panel shows the same, but with NGC 7078 integrated as an N-body system. The close passage in all panels occurred 332 Myr ago. The dashed black line represents the outer limit (1 pc) of the Oort particle distribution in the initial state. In the bottom panels, we present the distribution of particles in the inner Oort cloud.
Current usage metrics show cumulative count of Article Views (full-text article views including HTML views, PDF and ePub downloads, according to the available data) and Abstracts Views on Vision4Press platform.
Data correspond to usage on the plateform after 2015. The current usage metrics is available 48-96 hours after online publication and is updated daily on week days.
Initial download of the metrics may take a while.