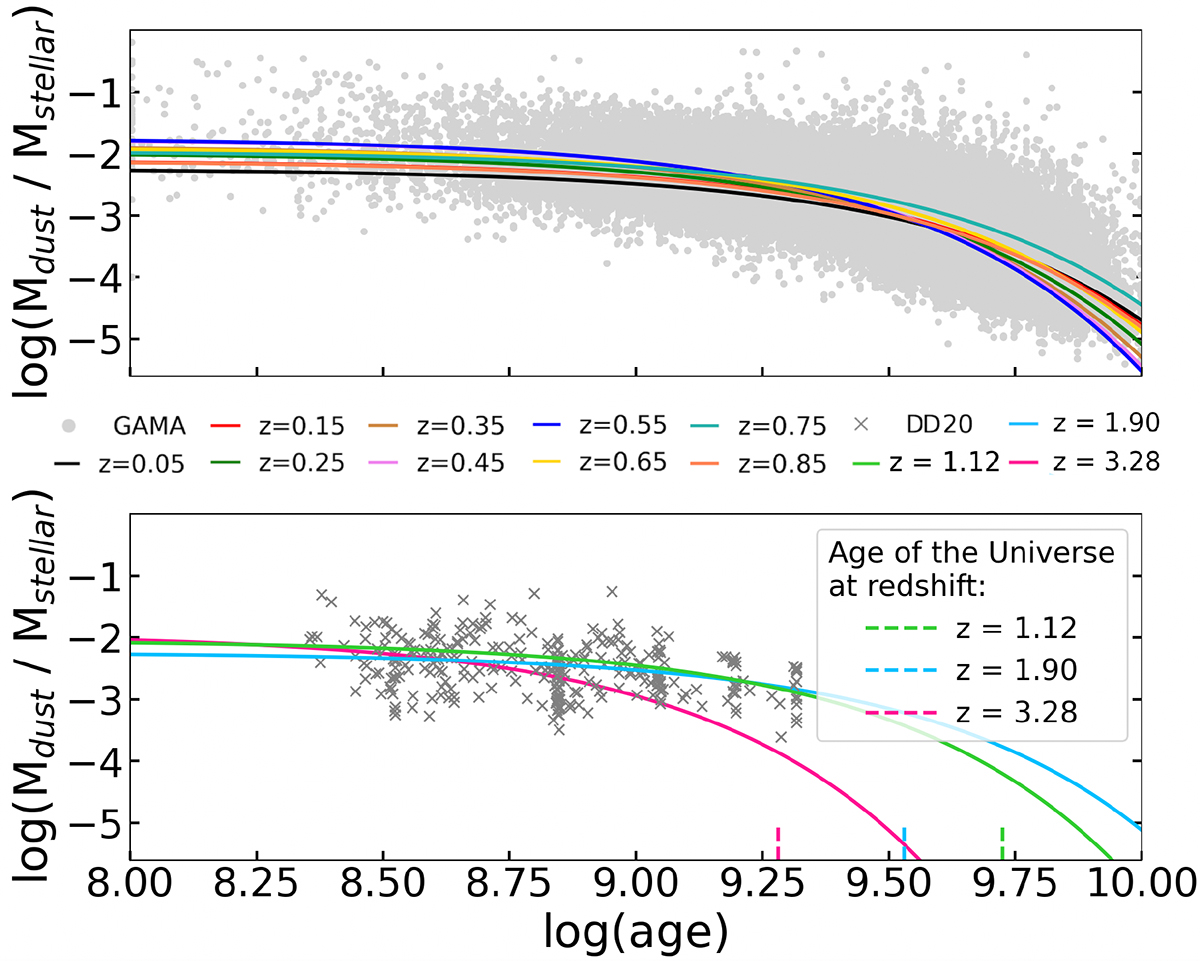
Fig. 2.
Download original image
Dust-to-stellar mass ratio as a function of stellar age. Top: GAMA galaxies (light grey dots) and exponential fits for redshift bins up to 0.9. Bottom: DD20 galaxies (grey cross markers) and exponential fits for redshift bins from z = 0.9 to z∼5. Vertical dashed lines represent the age of the Universe at the corresponding redshift (colours correspond to the redshift bins). Plots for the individual redshift bins and fits are included in Appendix A.1.
Current usage metrics show cumulative count of Article Views (full-text article views including HTML views, PDF and ePub downloads, according to the available data) and Abstracts Views on Vision4Press platform.
Data correspond to usage on the plateform after 2015. The current usage metrics is available 48-96 hours after online publication and is updated daily on week days.
Initial download of the metrics may take a while.