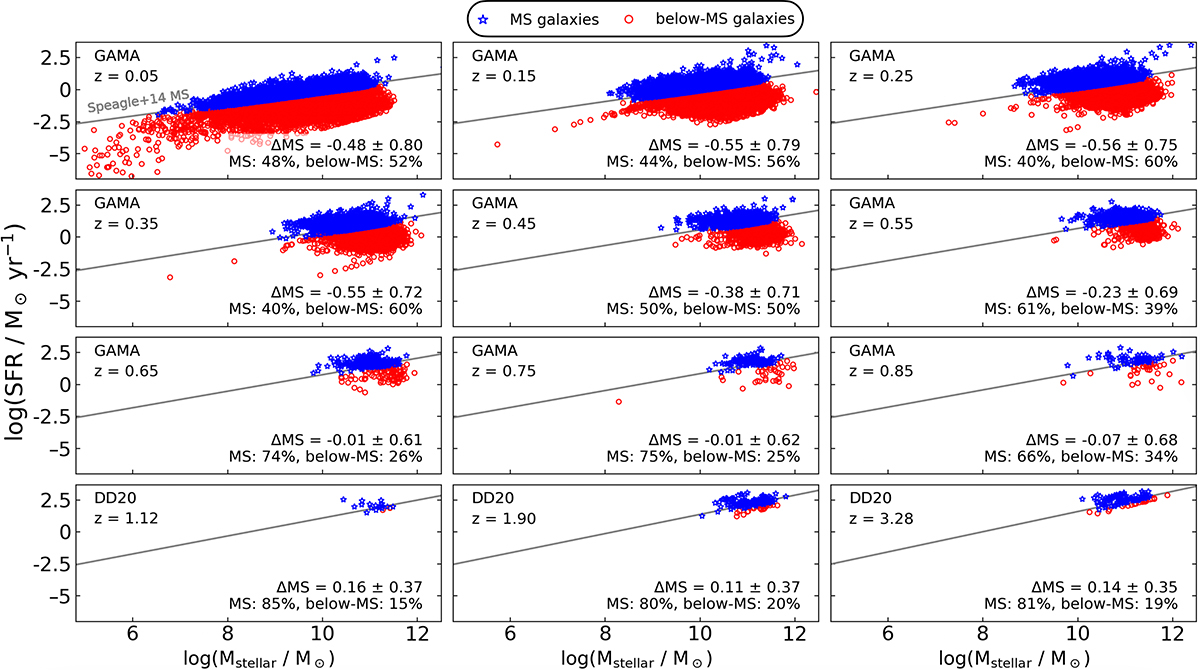
Fig. 1.
Download original image
SFR as a function of stellar mass for the GAMA sample (top three rows) and the DD20 sample (bottom row). The star-forming MS at median redshift of each redshift bin (grey line) based on Speagle et al. (2014) is shown. Colour coding distinguishes galaxies on or above the MS (blue stars) and galaxies below the MS (red circles). The MS offset of each redshift bin is presented at the bottom right of each panel together with the fraction of MS and below-MS galaxies.
Current usage metrics show cumulative count of Article Views (full-text article views including HTML views, PDF and ePub downloads, according to the available data) and Abstracts Views on Vision4Press platform.
Data correspond to usage on the plateform after 2015. The current usage metrics is available 48-96 hours after online publication and is updated daily on week days.
Initial download of the metrics may take a while.