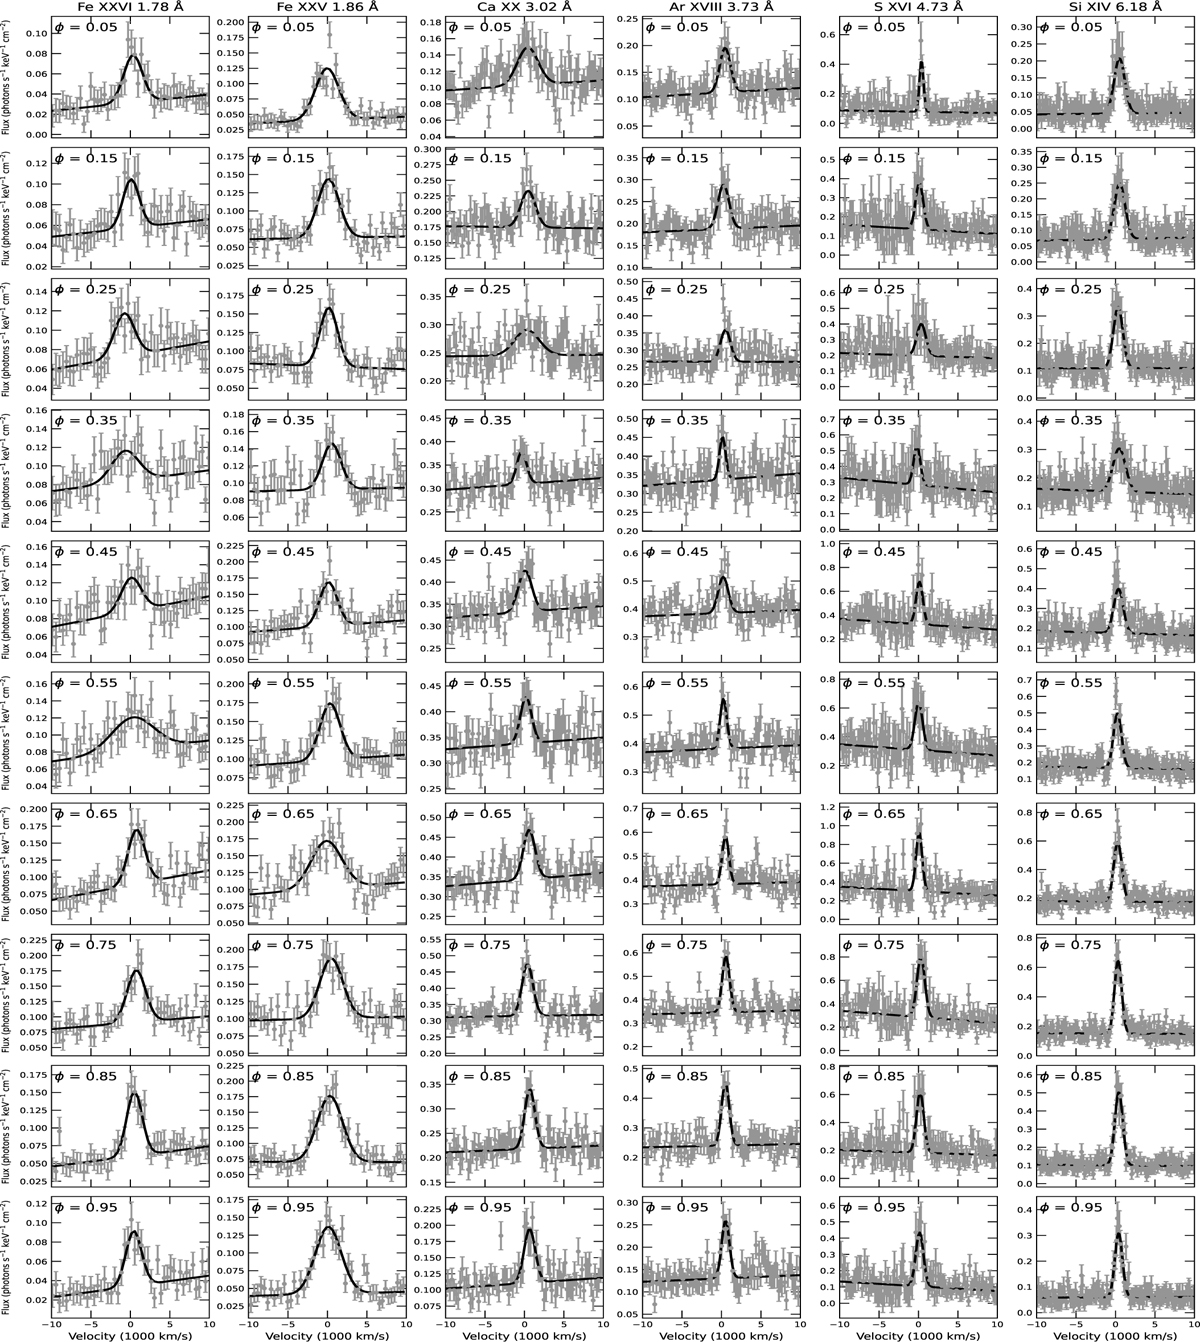
Fig. B.1
Download original image
Observed spectra of Fe XXVI 1.778 Å, Fe XXV 1.859 Å, Ca XX 3.018 Å, Ar XVIII 3.731 Å, S XVI 4.734 Å and Si XIV 6.184 Å are shown in vertical columns from left to right. Each column presents spectra at ten orbital phases from 0.05 (top) to 0.95 (bottom). The x-axis represents the velocity shift from the line wavelength (in units of 1000 km/s), while the y-axis shows the observed flux (photons/s/keV/cm2 on Earth) with error bars and the model-fit (solid line)
Current usage metrics show cumulative count of Article Views (full-text article views including HTML views, PDF and ePub downloads, according to the available data) and Abstracts Views on Vision4Press platform.
Data correspond to usage on the plateform after 2015. The current usage metrics is available 48-96 hours after online publication and is updated daily on week days.
Initial download of the metrics may take a while.