Fig. 5
Download original image
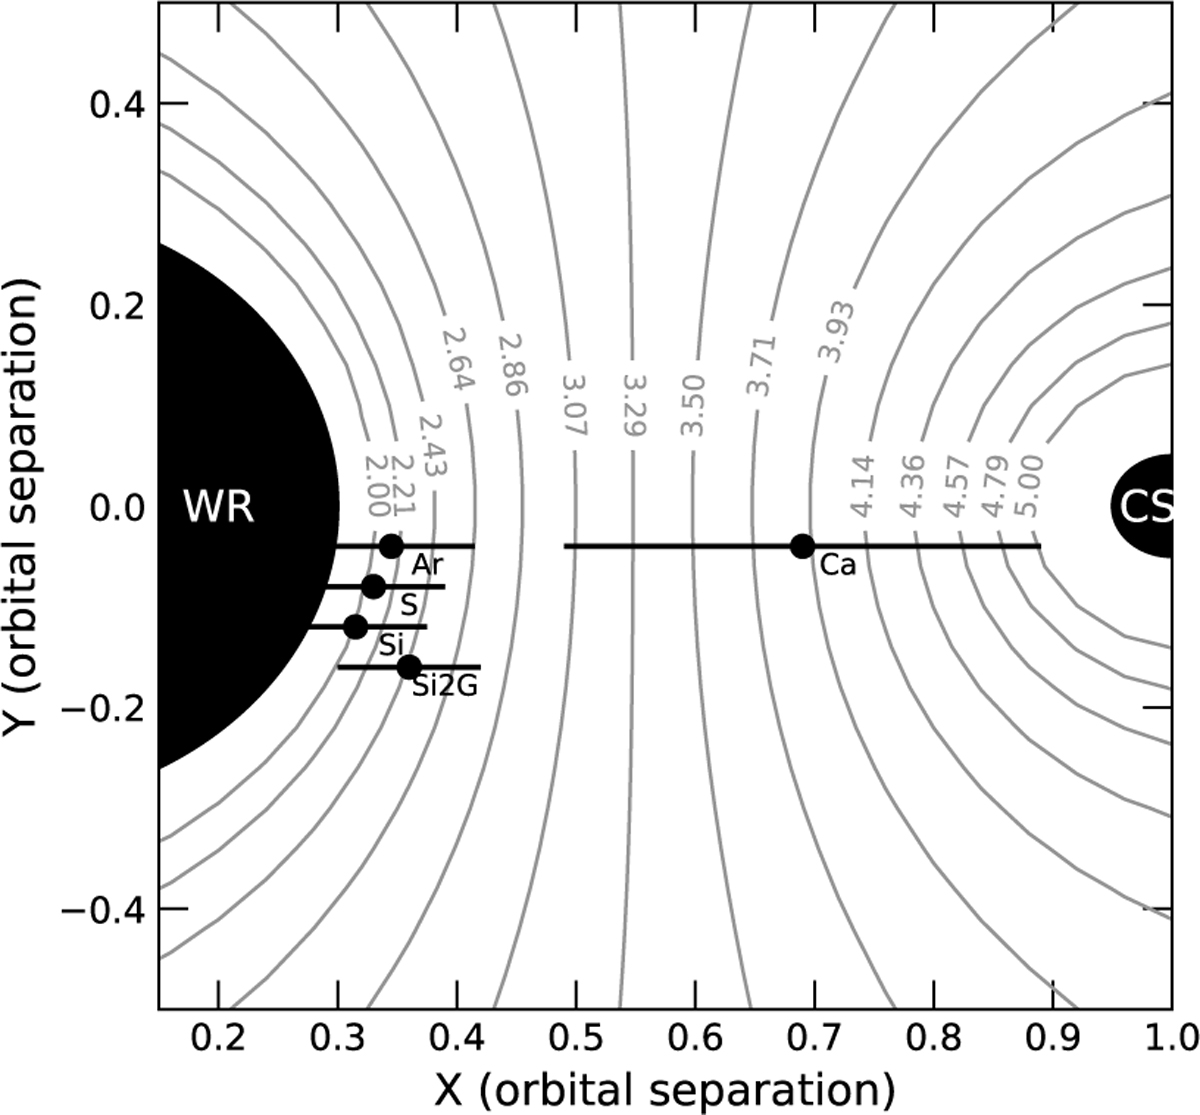
Alternative arrangement for the emission regions of the Si XIV, S XVI, Ar XVIII, and Ca XX lines. Parts of the Ca and Ar lines formed in the compact star disc or corona (see the text). The solid curves represent surfaces with a constant ionisation parameter marked by a log ξ-value. These curves are intersections with the (x,y) plane of 3D surfaces where the lines are expected to form. For clarity, the error bars have been shifted vertically from y=0. The coordinate system is the same as in Fig. 4.
Current usage metrics show cumulative count of Article Views (full-text article views including HTML views, PDF and ePub downloads, according to the available data) and Abstracts Views on Vision4Press platform.
Data correspond to usage on the plateform after 2015. The current usage metrics is available 48-96 hours after online publication and is updated daily on week days.
Initial download of the metrics may take a while.