Fig. 4
Download original image
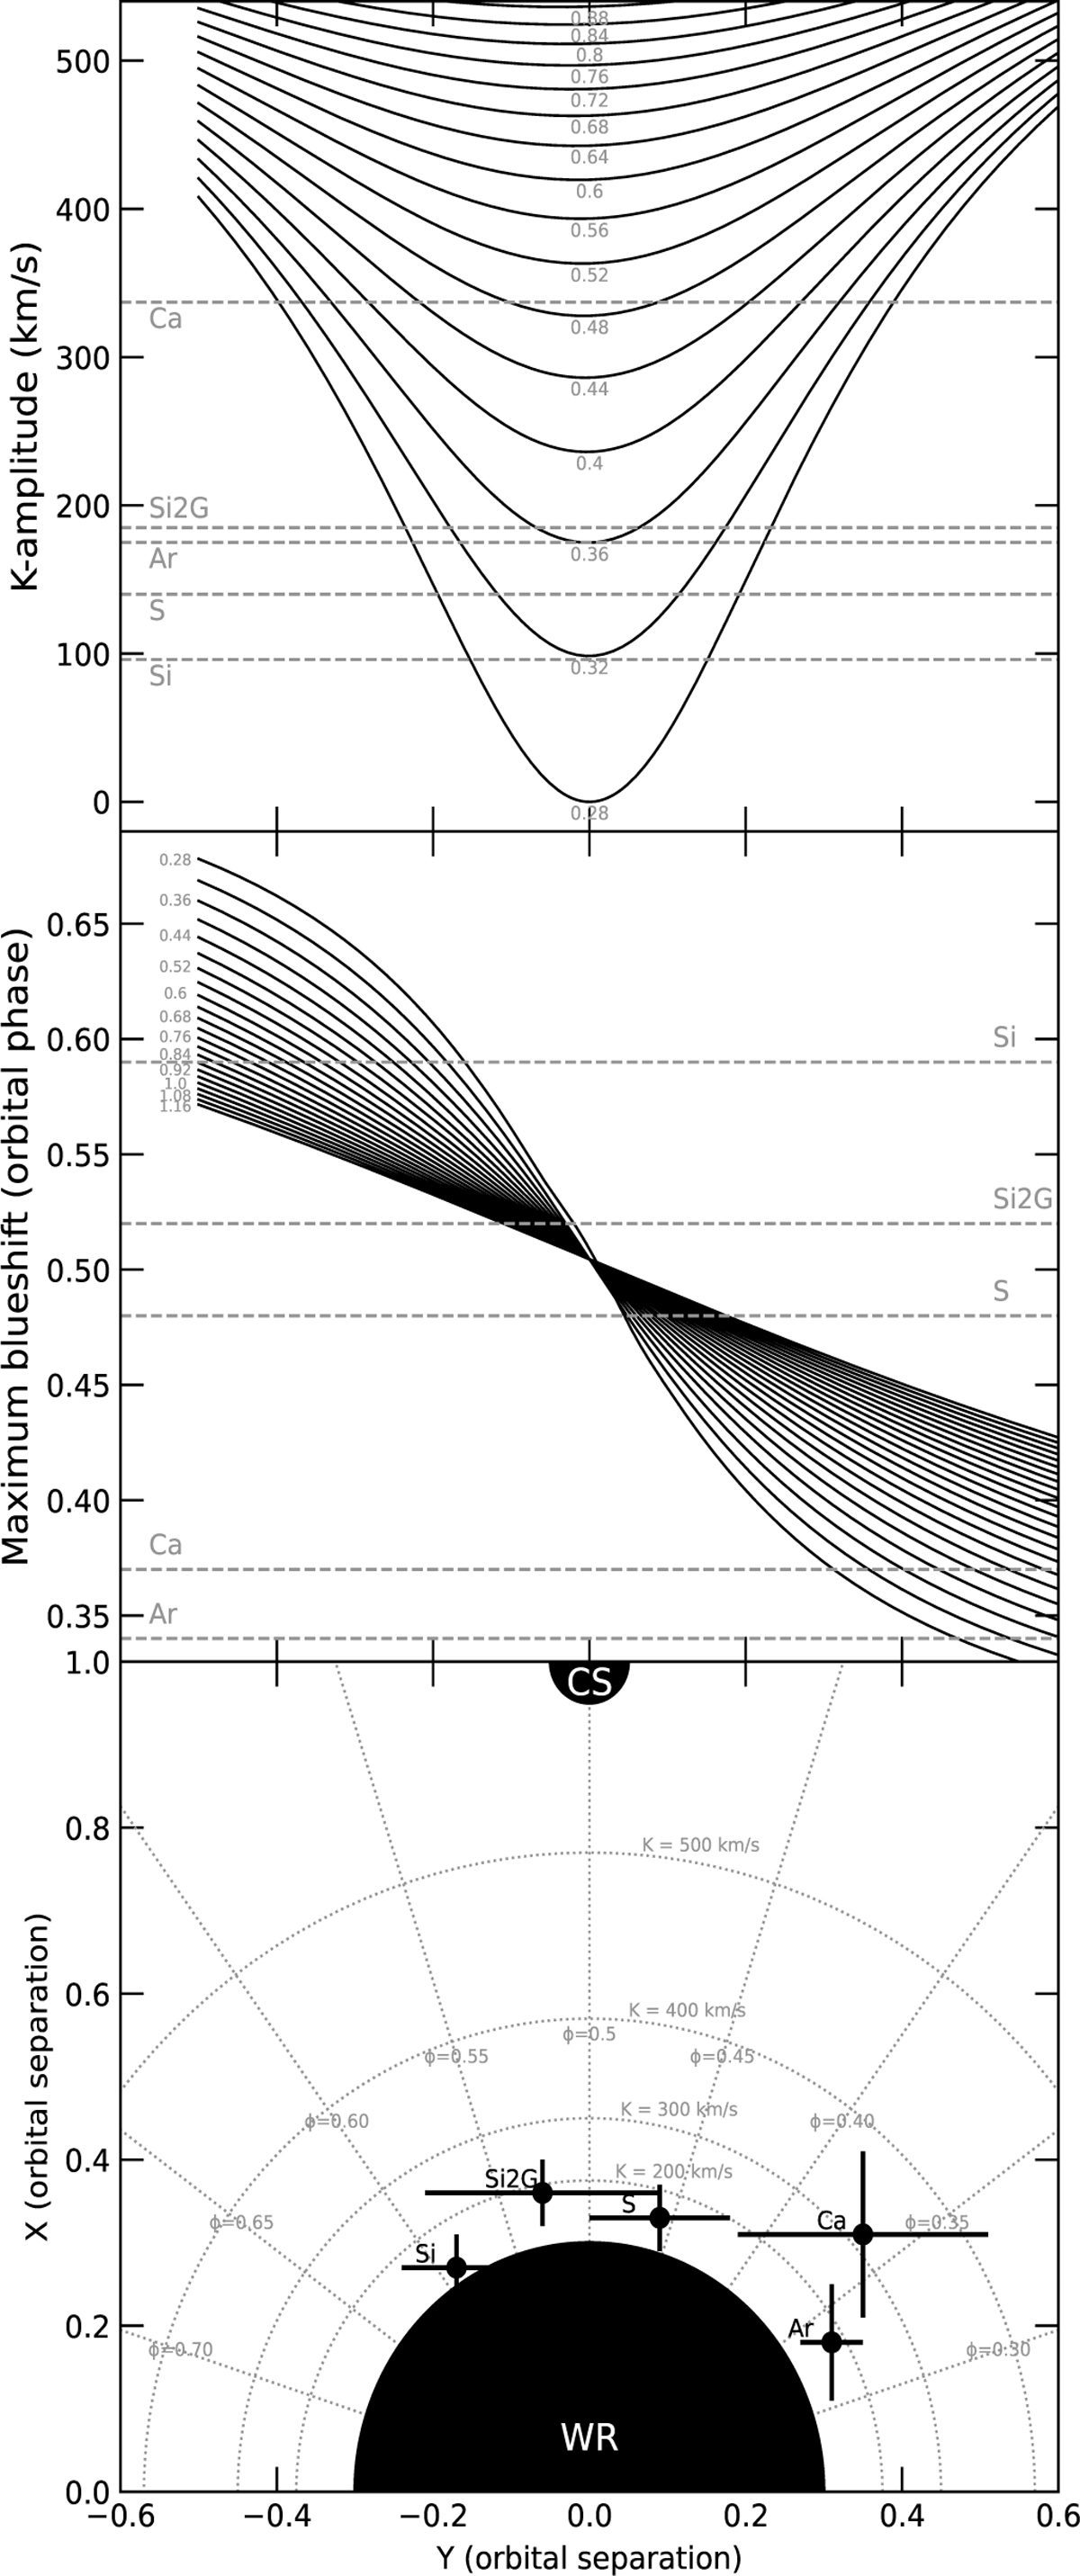
Top panel: K-amplitudes of grid points plotted against their y-values sorted by their x-values. Middle panel: same as the upper panel but for the orbital phases with the highest blueshift. The values corresponding to the observed emission lines are marked by horizontal lines. Bottom panel: line formation sites combining information from the two upper panels (dots with error bars). The bottom panel also shows (dotted) curved contours with constant K-values (200, 300, 400, and 500 km/s increasing from the WR surface) and radial (dotted) contours with the constant bluest phases ϕ (from 0.3 to 0.7).
Current usage metrics show cumulative count of Article Views (full-text article views including HTML views, PDF and ePub downloads, according to the available data) and Abstracts Views on Vision4Press platform.
Data correspond to usage on the plateform after 2015. The current usage metrics is available 48-96 hours after online publication and is updated daily on week days.
Initial download of the metrics may take a while.