Open Access
Fig. 2
Download original image
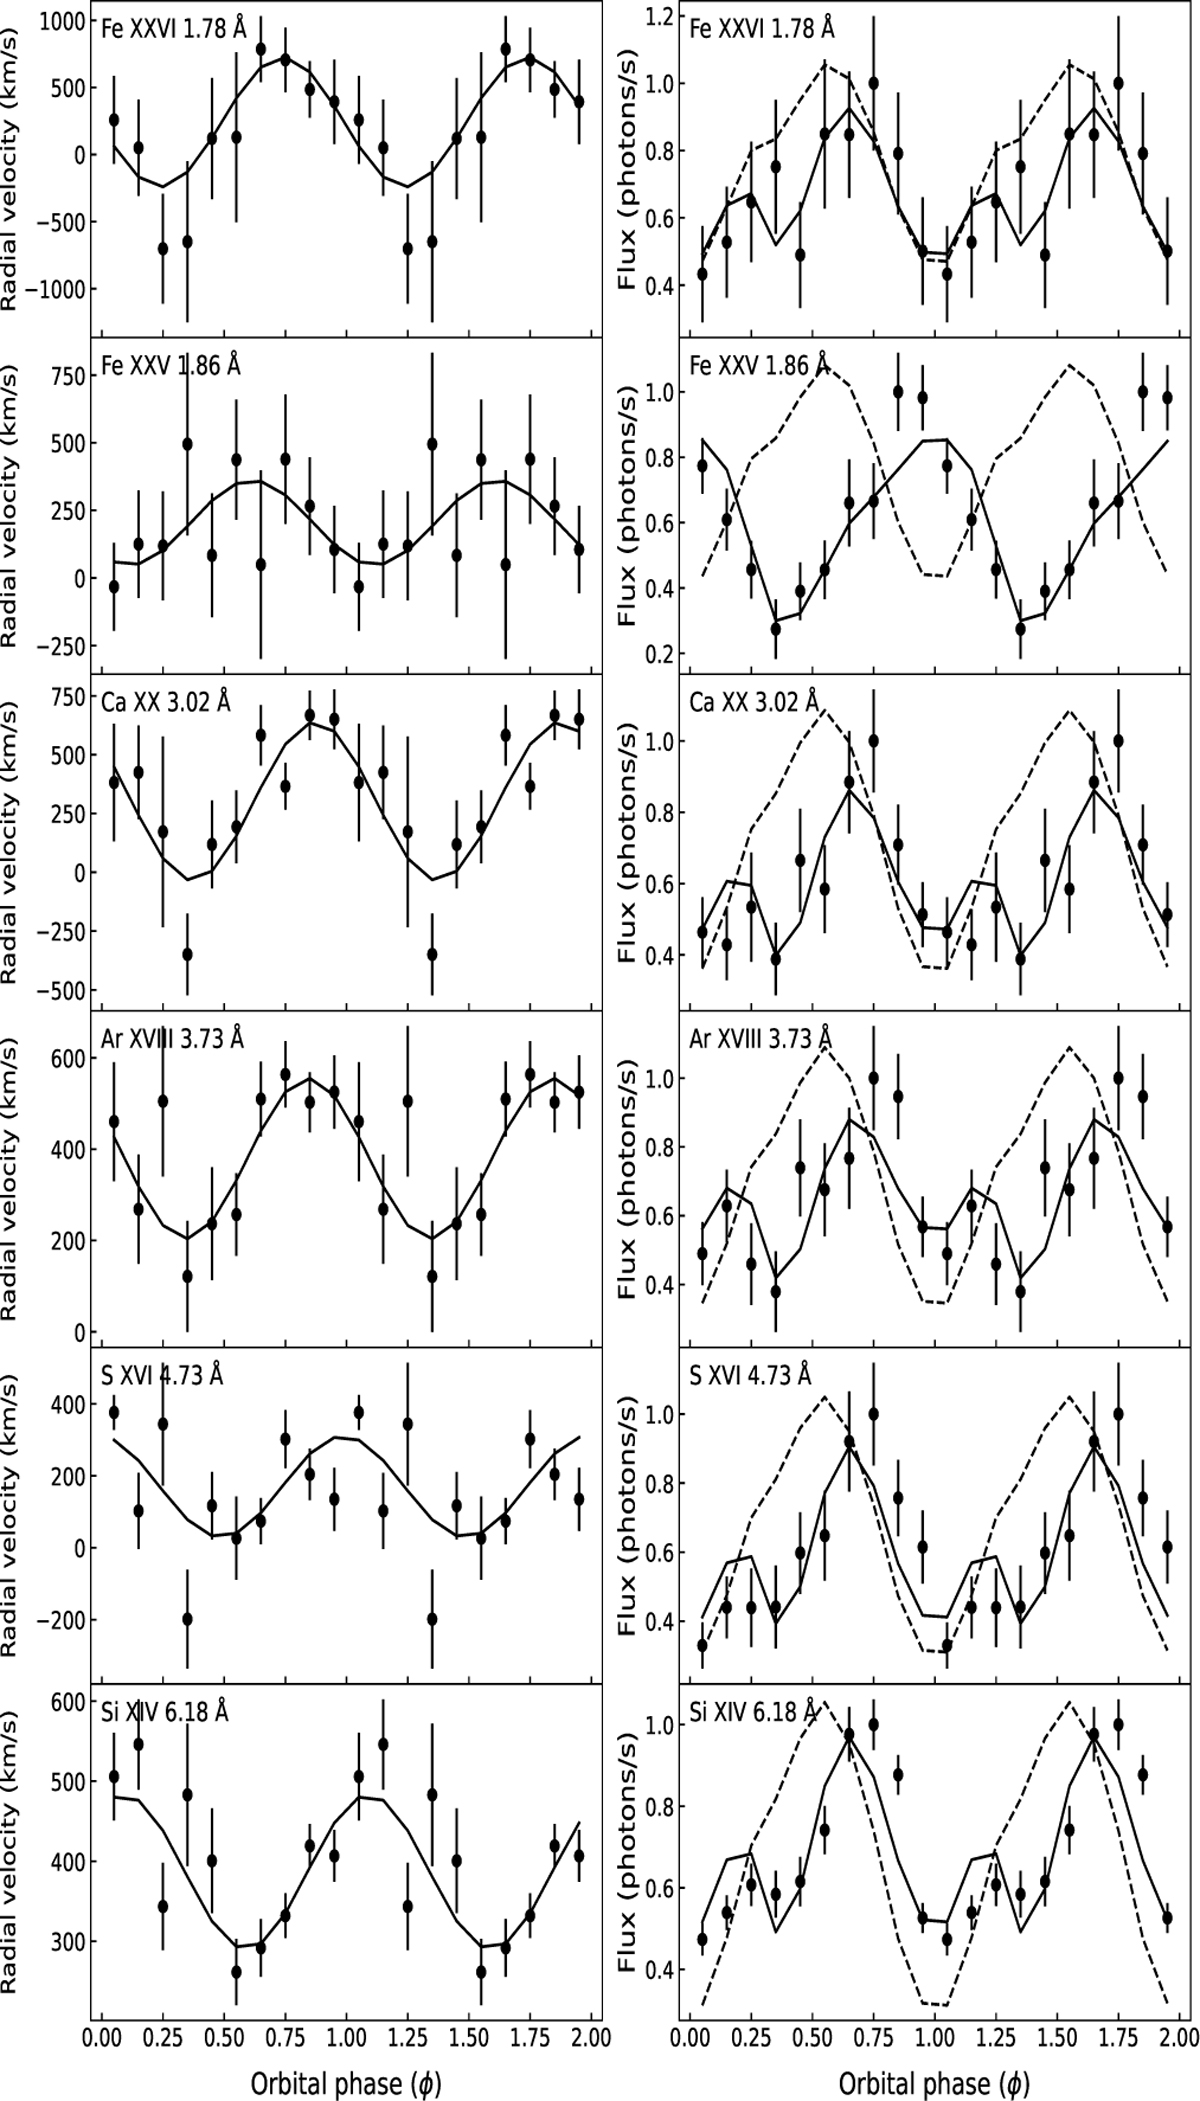
Sine curve fits for the radial velocity (km/s, left panels) and two-absorber fits for the line emission (scaled, photons/s, right panels) for the six analysed emission lines. The dashed line represents the continuum at the line.
Current usage metrics show cumulative count of Article Views (full-text article views including HTML views, PDF and ePub downloads, according to the available data) and Abstracts Views on Vision4Press platform.
Data correspond to usage on the plateform after 2015. The current usage metrics is available 48-96 hours after online publication and is updated daily on week days.
Initial download of the metrics may take a while.