Open Access
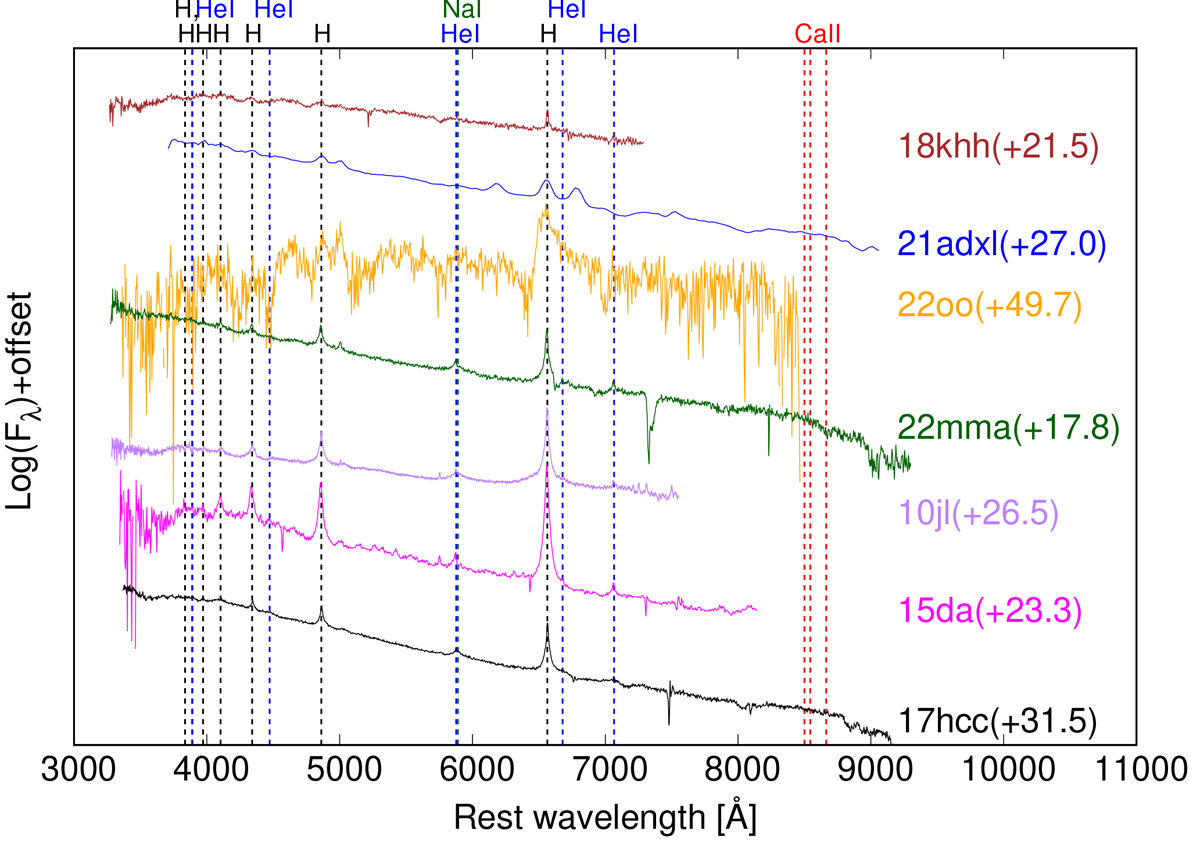
Fig. 6.
Download original image
Comparison of the early-phase spectra of the SNe in our sample. All spectra are corrected for extinction (see Section 2). The data for SNe 2010jl, 2015da, 2017hcc, and 2021adxl are taken from Smith et al. (2012), Tartaglia et al. (2020), Moran et al. (2023) and Brennan et al. (2024), respectively.
Current usage metrics show cumulative count of Article Views (full-text article views including HTML views, PDF and ePub downloads, according to the available data) and Abstracts Views on Vision4Press platform.
Data correspond to usage on the plateform after 2015. The current usage metrics is available 48-96 hours after online publication and is updated daily on week days.
Initial download of the metrics may take a while.