Open Access
Fig. B.2
Download original image
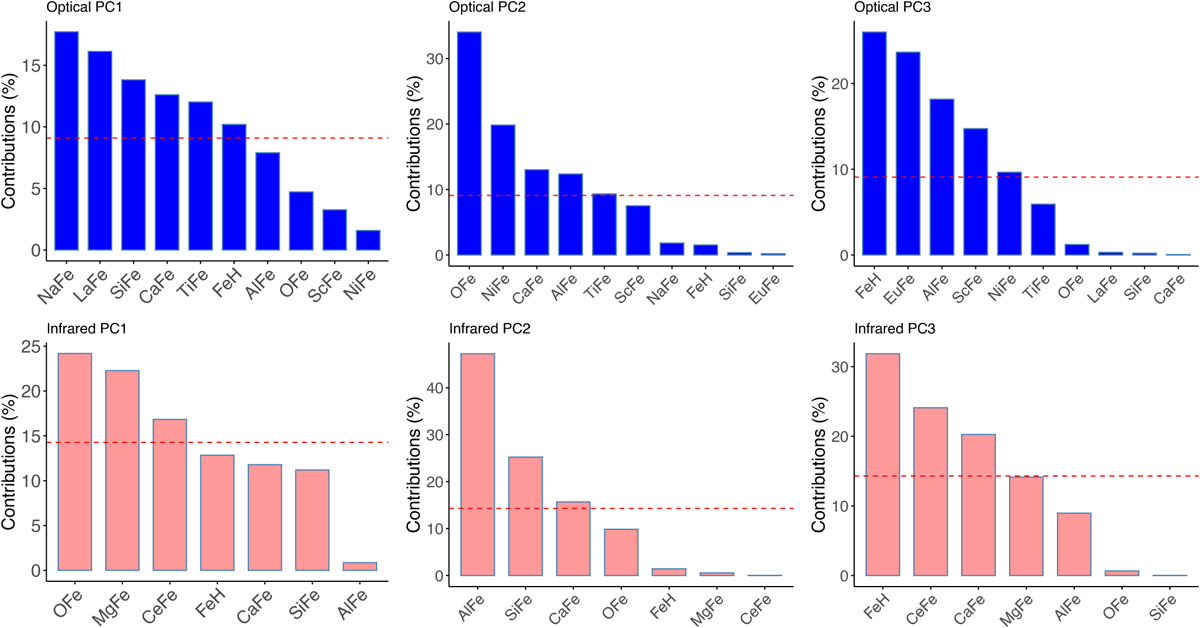
Contributions to the first principal components from each element. In blue the Optical Sample, in red the Infrared sample. The dashed red horizontal line delineates the 50% of contribution, helping us to see which elements contribute most each PC.
Current usage metrics show cumulative count of Article Views (full-text article views including HTML views, PDF and ePub downloads, according to the available data) and Abstracts Views on Vision4Press platform.
Data correspond to usage on the plateform after 2015. The current usage metrics is available 48-96 hours after online publication and is updated daily on week days.
Initial download of the metrics may take a while.