Open Access
Fig. 5
Download original image
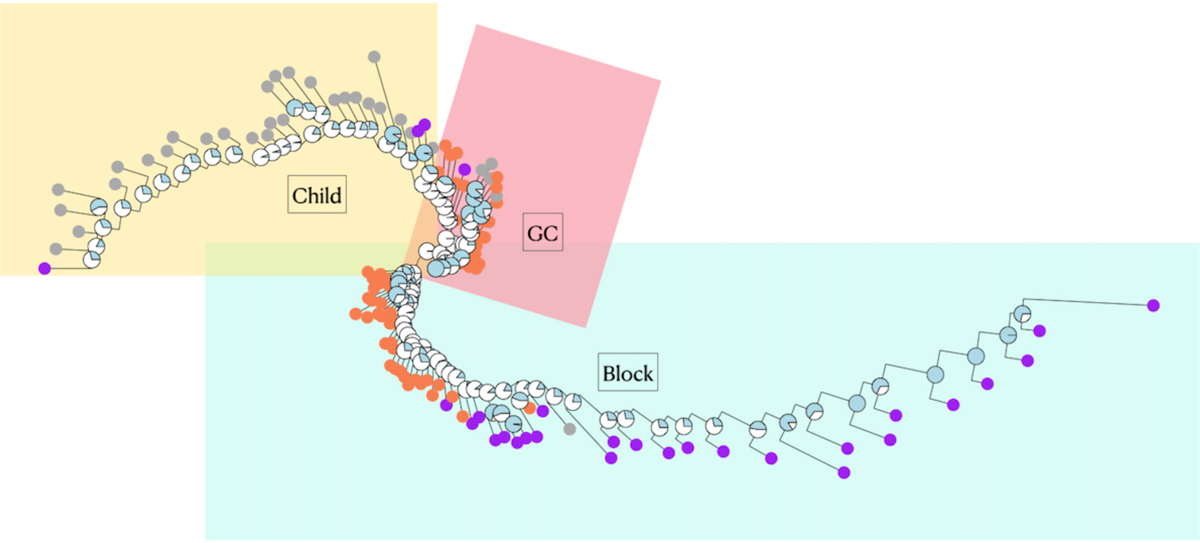
Circular Optical tree. The colors of the tips correspond to the GMM groups. The pie charts on the nodes correspond to the percentage of occurrence of the node in 1000 random generated trees considering the abundance uncertainties (node support), indicating that the tree has an overall support of 35%.
Current usage metrics show cumulative count of Article Views (full-text article views including HTML views, PDF and ePub downloads, according to the available data) and Abstracts Views on Vision4Press platform.
Data correspond to usage on the plateform after 2015. The current usage metrics is available 48-96 hours after online publication and is updated daily on week days.
Initial download of the metrics may take a while.