Fig. B.3
Download original image
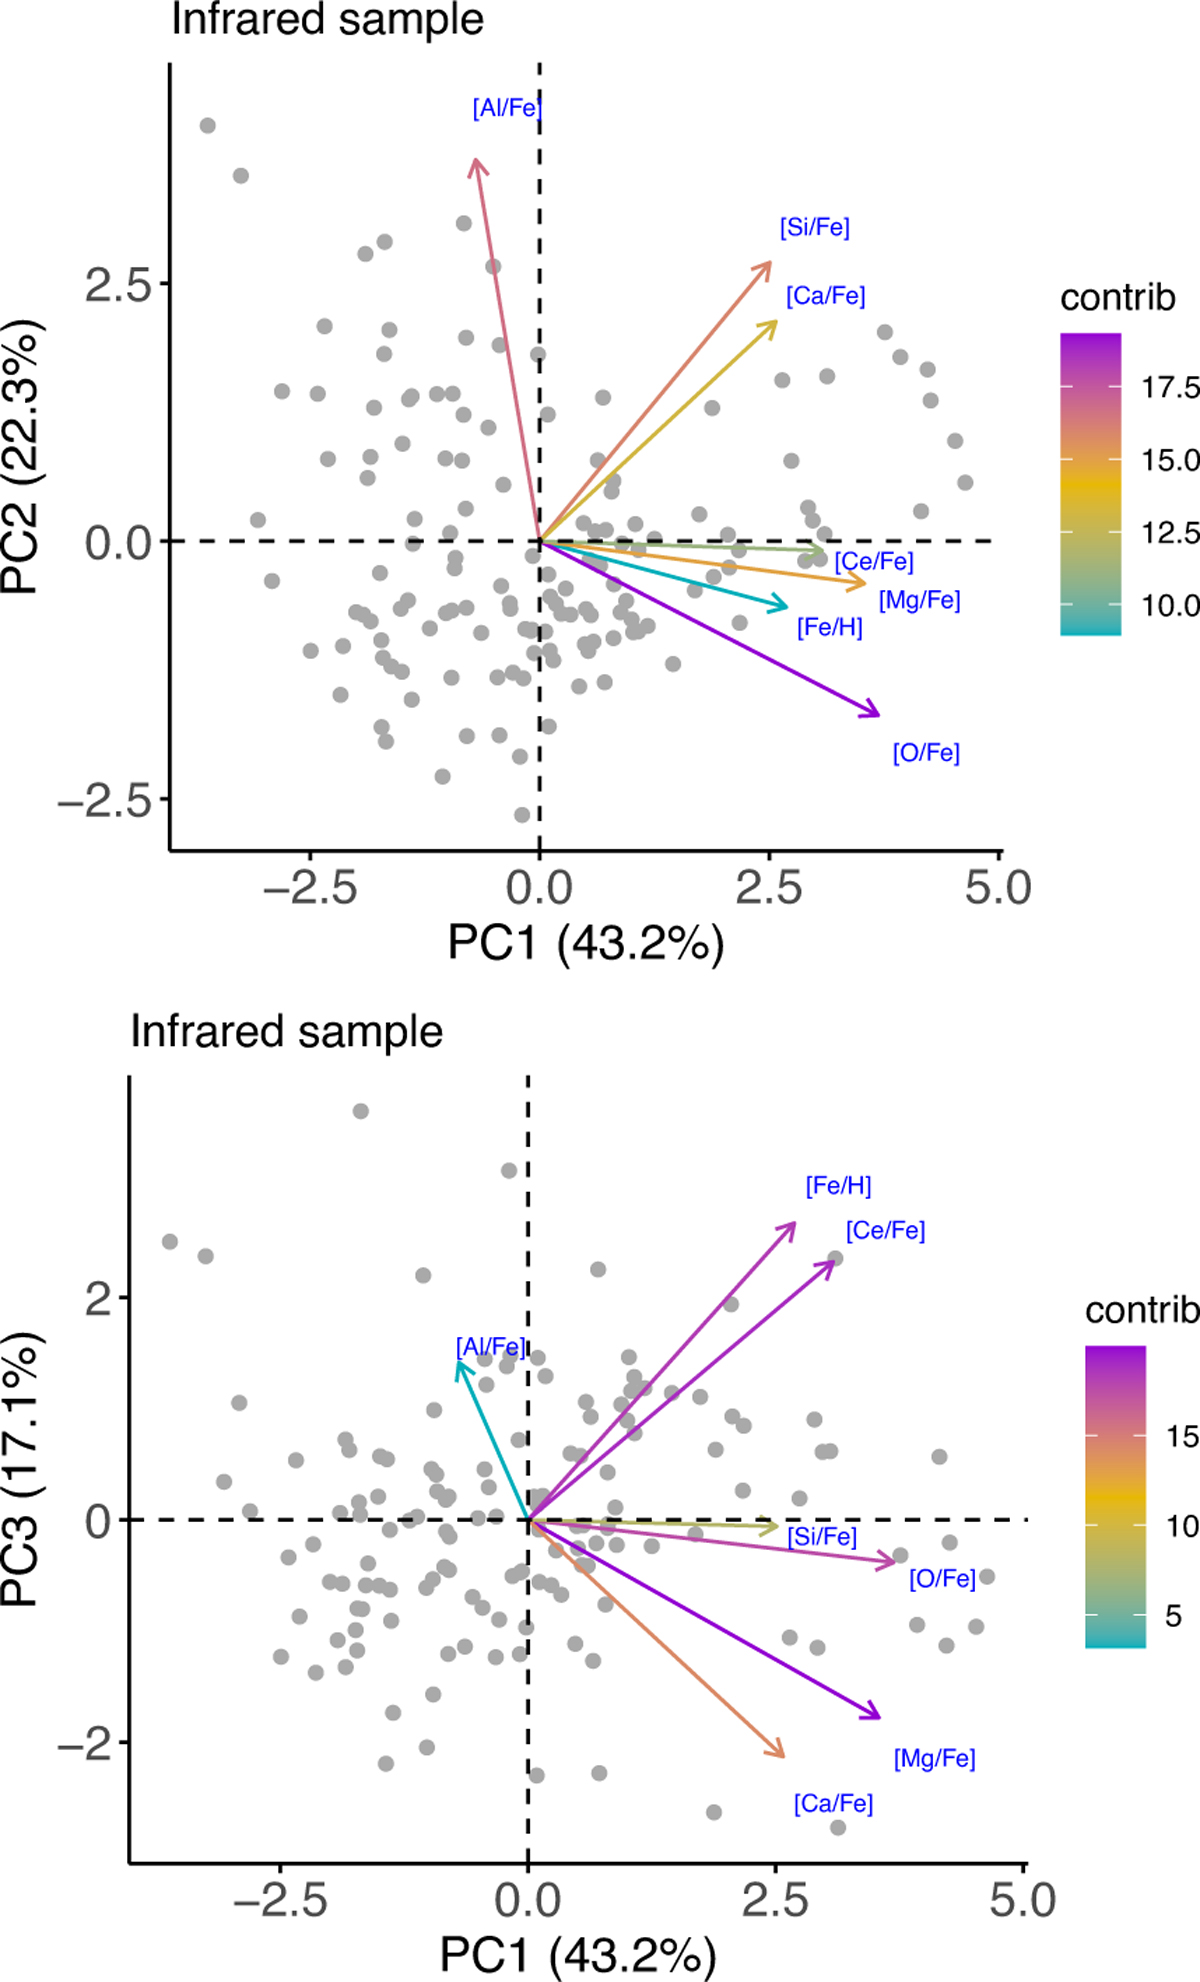
PCA planes with the direction and contribution of each chemical element in the first three most significant components of the Infrared sample. Stars are distributed in the planes and arrows indicate the direction to which the abundance ratios are higher in these planes. Colors indicate the contribution to the PCA of the abundance ratios. The first two dimensions show how [O/Fe] and [Al/Fe] dominate the variance, contributing to opposite directions in these planes. This is due to the anticorrelation of these elements.
Current usage metrics show cumulative count of Article Views (full-text article views including HTML views, PDF and ePub downloads, according to the available data) and Abstracts Views on Vision4Press platform.
Data correspond to usage on the plateform after 2015. The current usage metrics is available 48-96 hours after online publication and is updated daily on week days.
Initial download of the metrics may take a while.