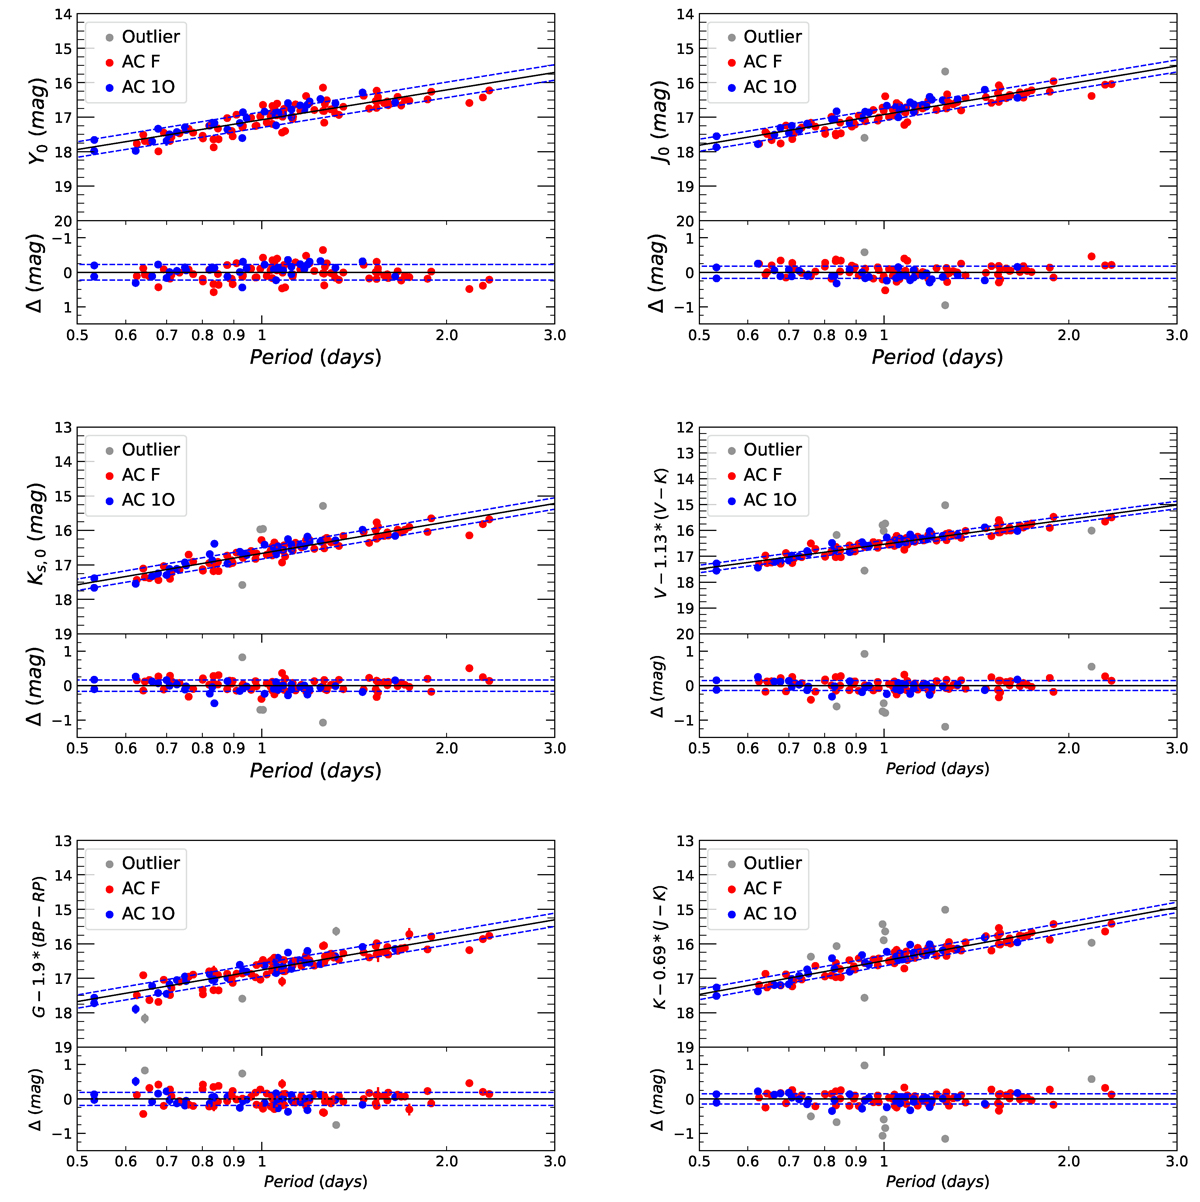
Fig. 8.
Download original image
Example of fits for the F and 1O ACs in the LMC after 1O ACs were fundametalized by adding 0.145 to the logarithm of their periods. Each row contains two figures displayed in the left and right panels, respectively, in the following order: PLY, PLJ, PLKs, PWVI, PWVKs, PWG, PWYK, and PWJKs. For each figure, the upper subpanel shows the best-fitting line, while the lower subpanel reports the fit residuals. Red and blue filled circles represent the F and 1O mode ACs, respectively. The gray filled circles are outlier objects not included in the fit. The solid black line is the best fit to the data, while the dashed blue lines show the ±1σ levels. The best fits in additional bands can be found in Appendix E.
Current usage metrics show cumulative count of Article Views (full-text article views including HTML views, PDF and ePub downloads, according to the available data) and Abstracts Views on Vision4Press platform.
Data correspond to usage on the plateform after 2015. The current usage metrics is available 48-96 hours after online publication and is updated daily on week days.
Initial download of the metrics may take a while.