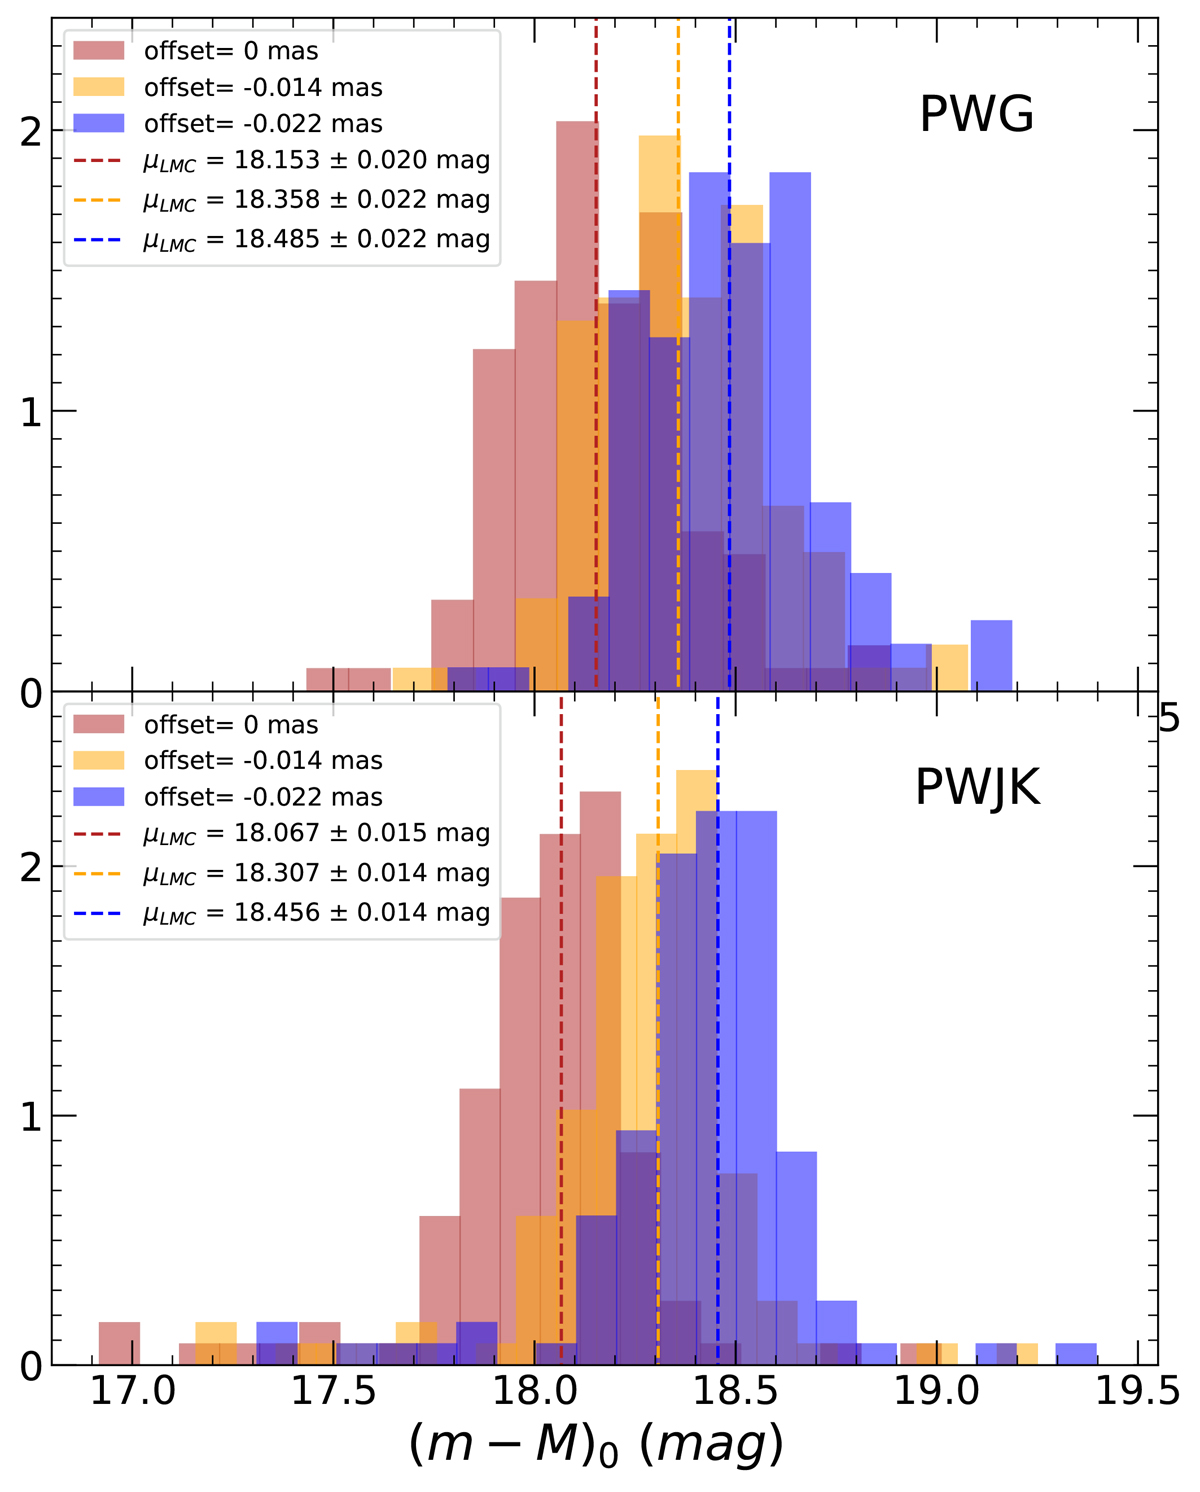
Fig. 11.
Download original image
Distribution of the inferred LMC absolute distance moduli calibrated through Gaia DR3 MW AC parallaxes. The red histogram corresponds to the values obtained using MW AC parallaxes with no counter zero-point offset, while the red vertical line is the median of the distribution. The orange and blue histograms and vertical lines are the same as the red ones but were respectively derived using the counter zero-point offsets ϖZP = −0.014 mas, as suggested by Riess et al. (2021), and ϖZP = −0.022 mas, as suggested by Molinaro et al. (2023).
Current usage metrics show cumulative count of Article Views (full-text article views including HTML views, PDF and ePub downloads, according to the available data) and Abstracts Views on Vision4Press platform.
Data correspond to usage on the plateform after 2015. The current usage metrics is available 48-96 hours after online publication and is updated daily on week days.
Initial download of the metrics may take a while.