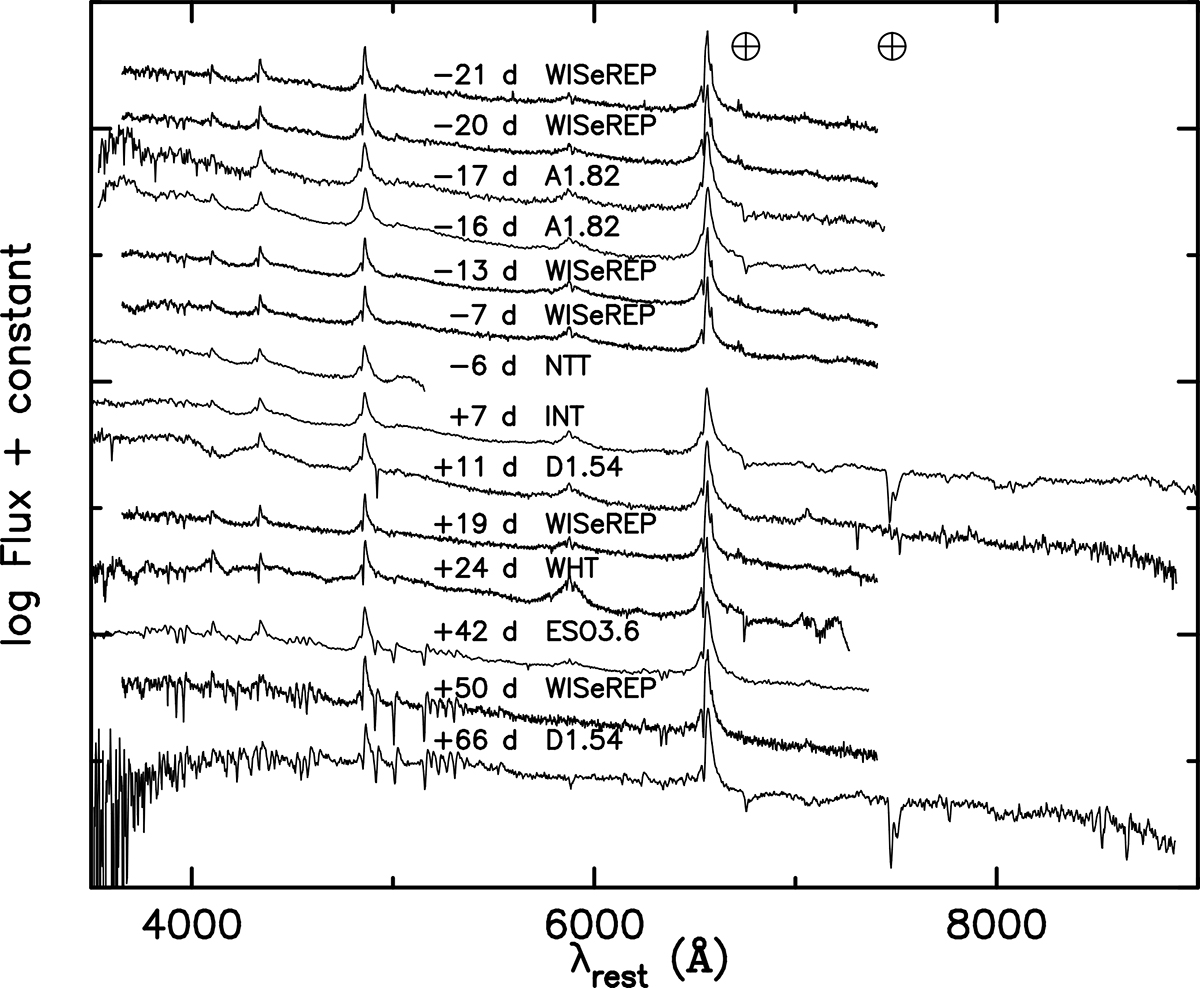
Fig. 5.
Download original image
Spectroscopic time series of SN 1999eb with epochs and used telescopes indicated. For completeness, the sequence includes also the public spectra on the WISeREP database (no available details on the used instruments). The spectra were dereddened by the Galactic extinction and the wavelengths corrected to the host galaxy rest frame. The wavelength of the most prominent telluric bands are indicated with a ⊕ symbol. For clarity, some of the lower quality spectra were omitted from the series and the spectra have been vertically shifted.
Current usage metrics show cumulative count of Article Views (full-text article views including HTML views, PDF and ePub downloads, according to the available data) and Abstracts Views on Vision4Press platform.
Data correspond to usage on the plateform after 2015. The current usage metrics is available 48-96 hours after online publication and is updated daily on week days.
Initial download of the metrics may take a while.