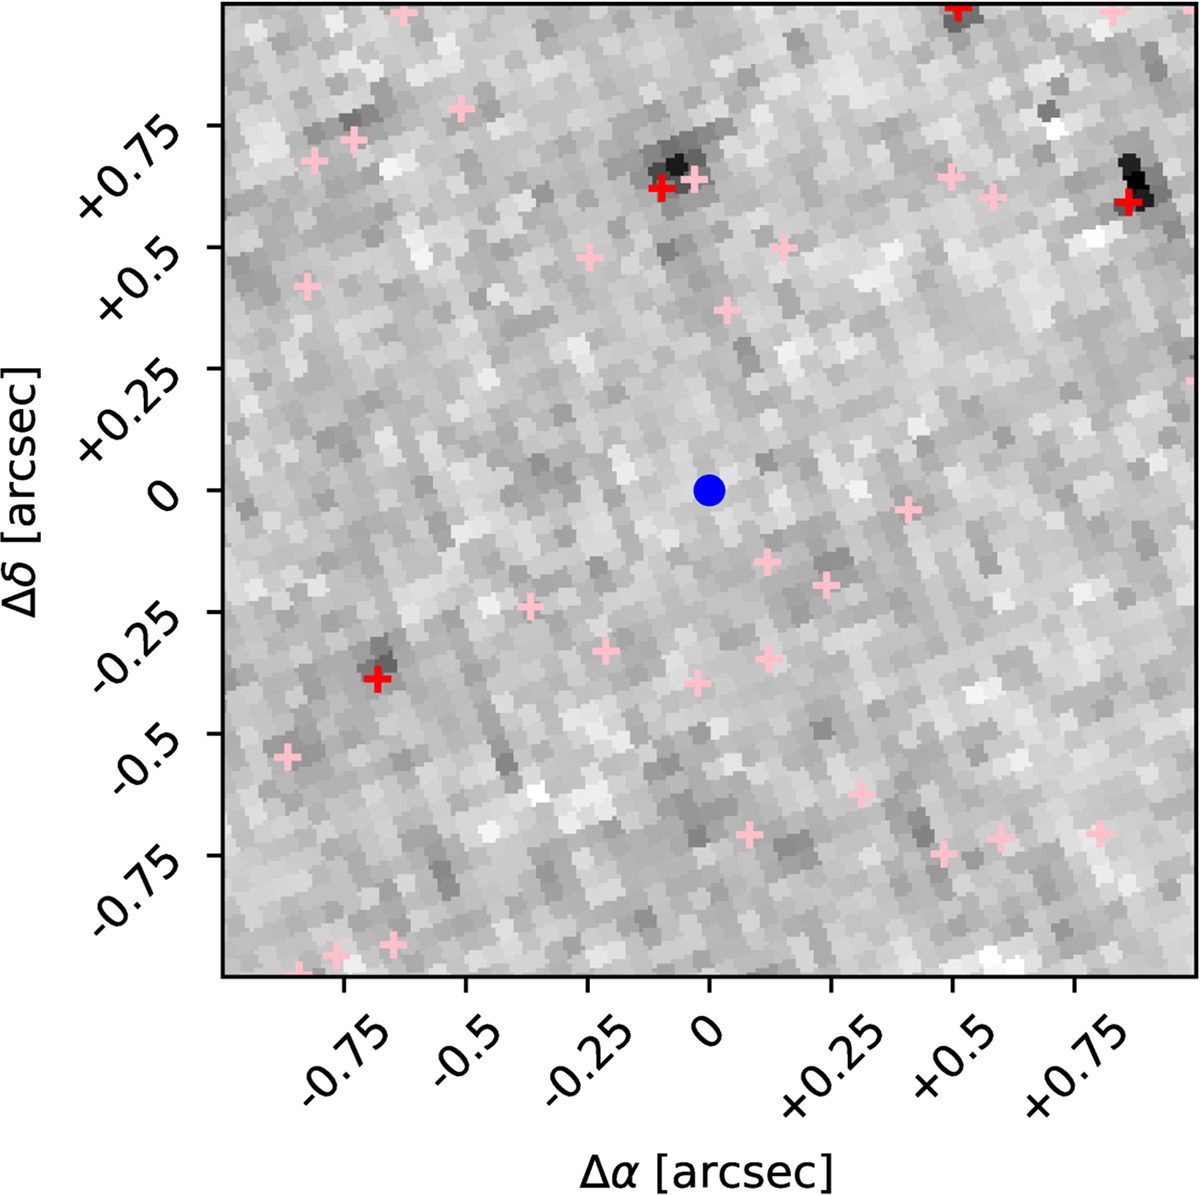
Fig. 10.
Download original image
2×2 arcsec2 cut-out of the drizzled F555W image with north up and east left from 10 March 2017, centred on the position of SN 2011ht (indicated with a blue circle). Sources detected at S/N>3 in this image are plotted in pink, while those detected with S/N>5 are plotted in red. A deep limit of MF555W>−4.0 mag is derived for the location of the event.
Current usage metrics show cumulative count of Article Views (full-text article views including HTML views, PDF and ePub downloads, according to the available data) and Abstracts Views on Vision4Press platform.
Data correspond to usage on the plateform after 2015. The current usage metrics is available 48-96 hours after online publication and is updated daily on week days.
Initial download of the metrics may take a while.