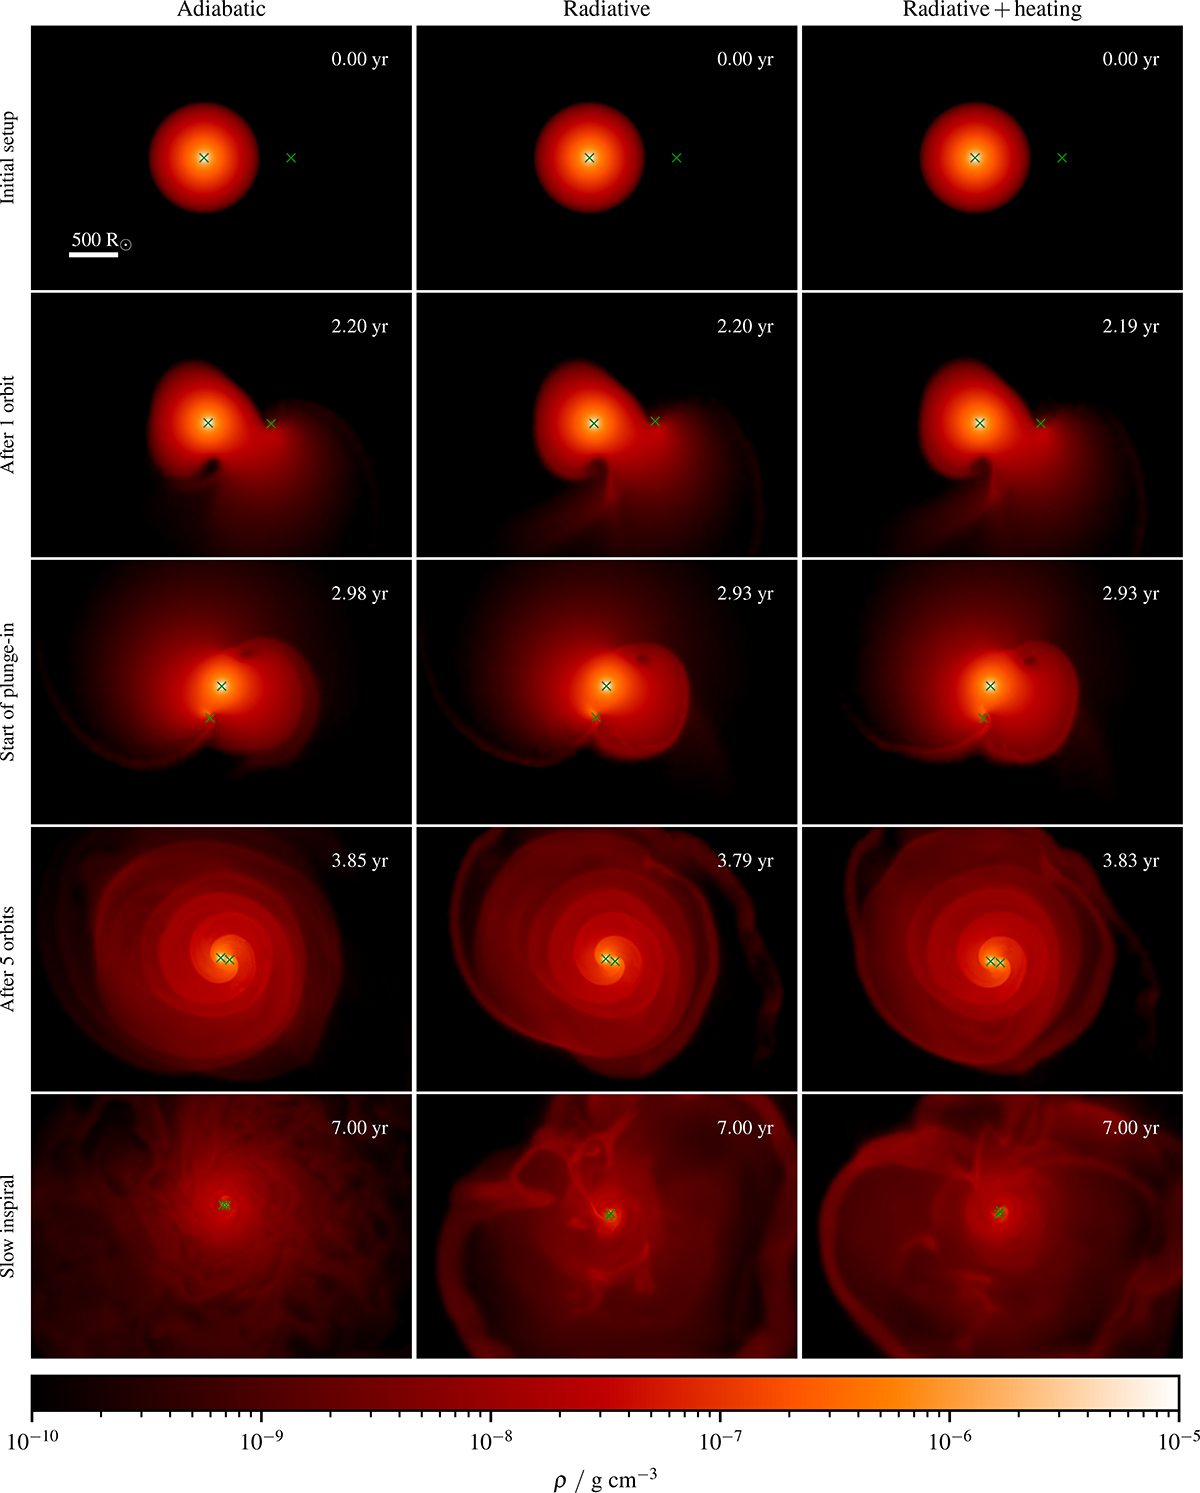
Fig. 2.
Download original image
Density in the initial orbital plane (z = 0) in 4320-by-3000 R⊙ panels. The crosses mark the locations of the donor’s core and the companion. Each column corresponds to a different simulation while each row corresponds to a different stage in the evolution. Row 5 shows the slow inspiral taking place several years after the plunge-in. The inspiral timescale, ![]() ), is several hundred to a thousand times longer than the orbital period. This figure was made with the SARRACEN package (Harris & Tricco 2023). Online movies of our simulations are listed in Table D.1.
), is several hundred to a thousand times longer than the orbital period. This figure was made with the SARRACEN package (Harris & Tricco 2023). Online movies of our simulations are listed in Table D.1.
Current usage metrics show cumulative count of Article Views (full-text article views including HTML views, PDF and ePub downloads, according to the available data) and Abstracts Views on Vision4Press platform.
Data correspond to usage on the plateform after 2015. The current usage metrics is available 48-96 hours after online publication and is updated daily on week days.
Initial download of the metrics may take a while.