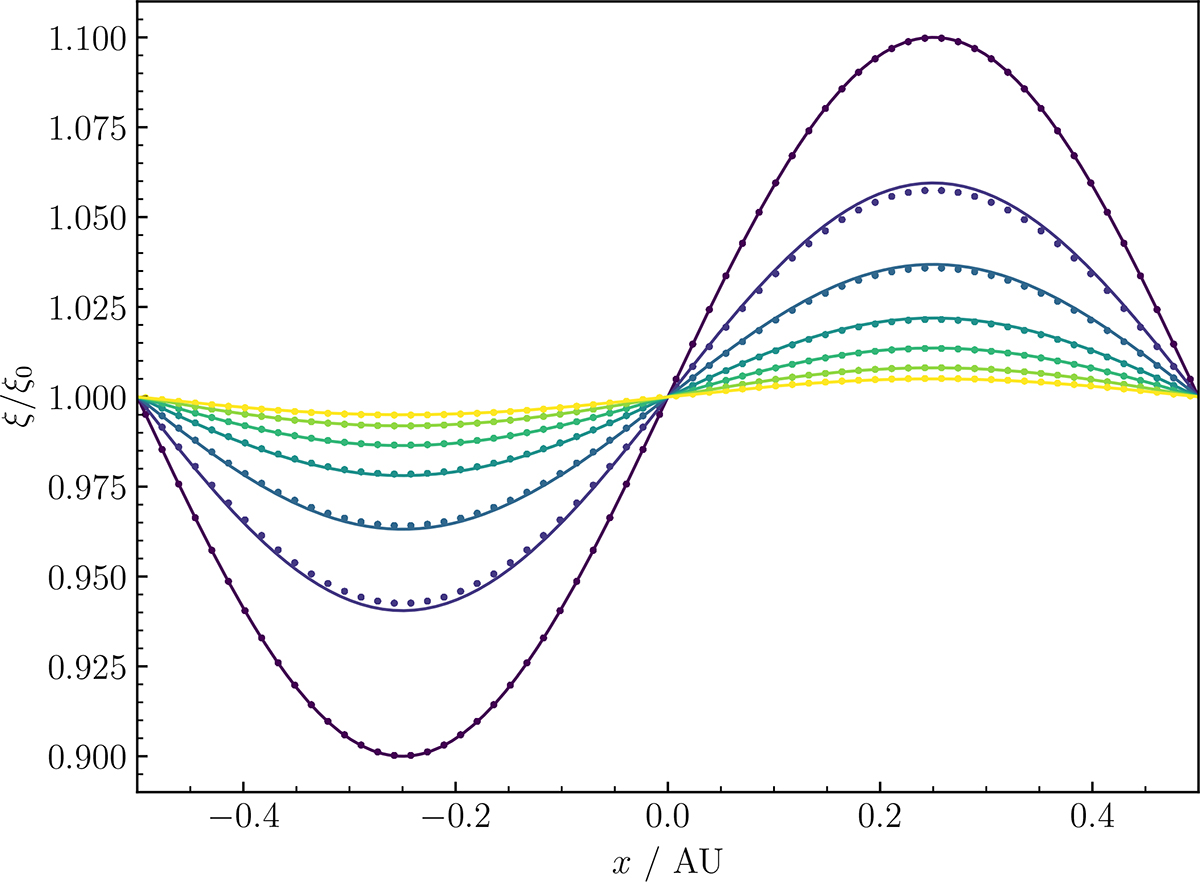
Fig. C.2.
Download original image
Diffusion of sinusoidally varying specific radiation energy. The markers represent results obtained from the implicit radiation solver, while solid lines show the analytical solution to the heat equation. The solutions at seven equally spaced times are plotted, with darker lines indicating earlier times and lighter lines representing later times.
Current usage metrics show cumulative count of Article Views (full-text article views including HTML views, PDF and ePub downloads, according to the available data) and Abstracts Views on Vision4Press platform.
Data correspond to usage on the plateform after 2015. The current usage metrics is available 48-96 hours after online publication and is updated daily on week days.
Initial download of the metrics may take a while.