Open Access
Fig. 9
Download original image
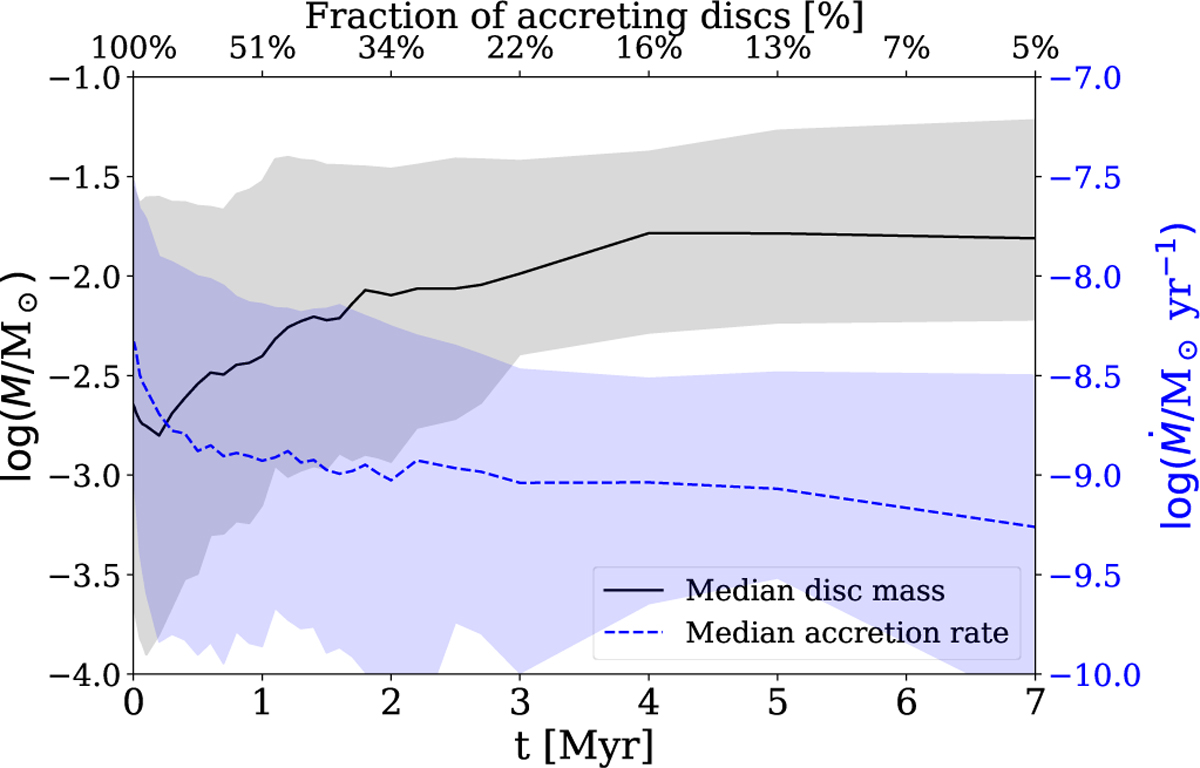
Evolution of the median disc mass (solid black line) and the median accretion rate (dashed blue line) over time with shaded regions representing the one-sigma confidence intervals of the population. The fraction of accreting discs at each timestep is shown above the plot.
Current usage metrics show cumulative count of Article Views (full-text article views including HTML views, PDF and ePub downloads, according to the available data) and Abstracts Views on Vision4Press platform.
Data correspond to usage on the plateform after 2015. The current usage metrics is available 48-96 hours after online publication and is updated daily on week days.
Initial download of the metrics may take a while.