Open Access
Fig. 8
Download original image
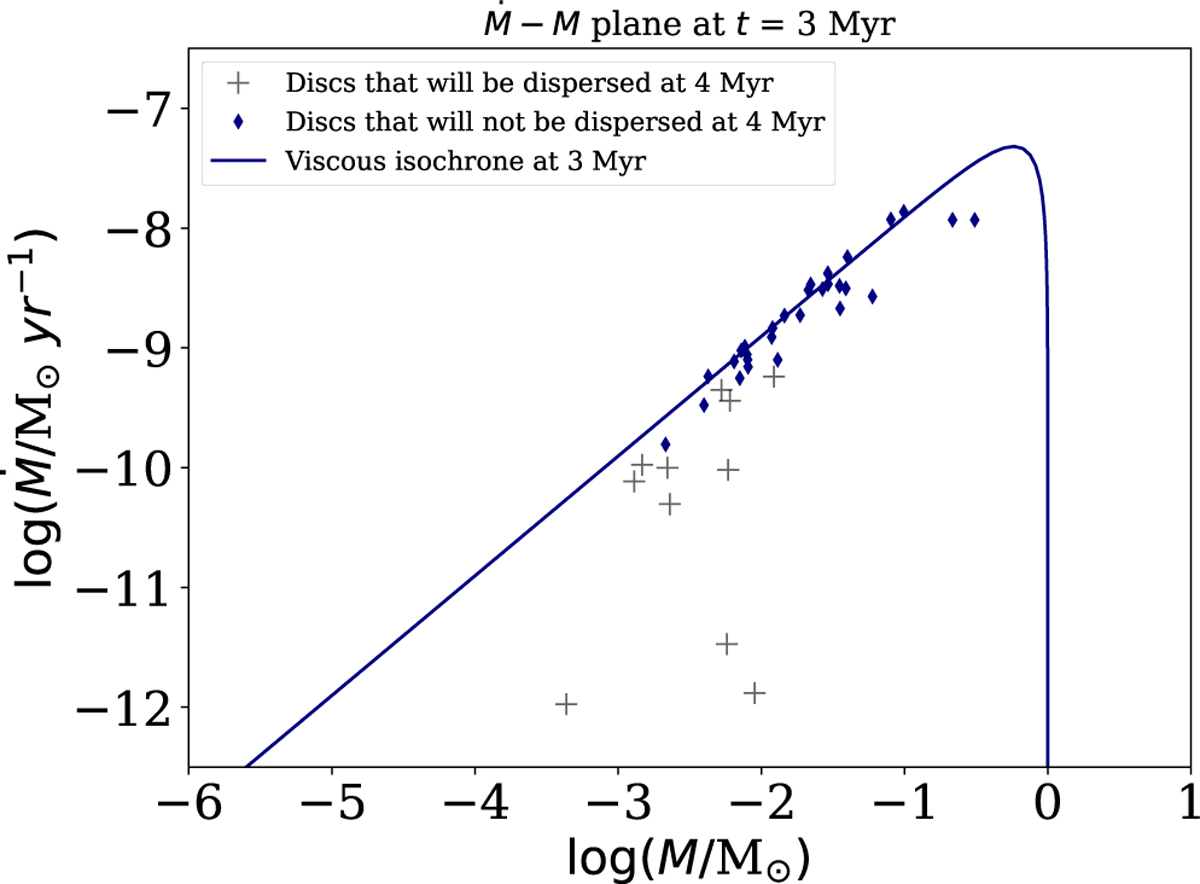
Population in the ![]() plane at 3 Myr, compared to the viscous isochrone. Blue diamonds represent discs that are not dispersed at 4 Myr, while grey crosses represent discs that are dispersed at 4 Myr. The former correspond to the shaded histogram in Fig. 7.
plane at 3 Myr, compared to the viscous isochrone. Blue diamonds represent discs that are not dispersed at 4 Myr, while grey crosses represent discs that are dispersed at 4 Myr. The former correspond to the shaded histogram in Fig. 7.
Current usage metrics show cumulative count of Article Views (full-text article views including HTML views, PDF and ePub downloads, according to the available data) and Abstracts Views on Vision4Press platform.
Data correspond to usage on the plateform after 2015. The current usage metrics is available 48-96 hours after online publication and is updated daily on week days.
Initial download of the metrics may take a while.