Fig. 6
Download original image
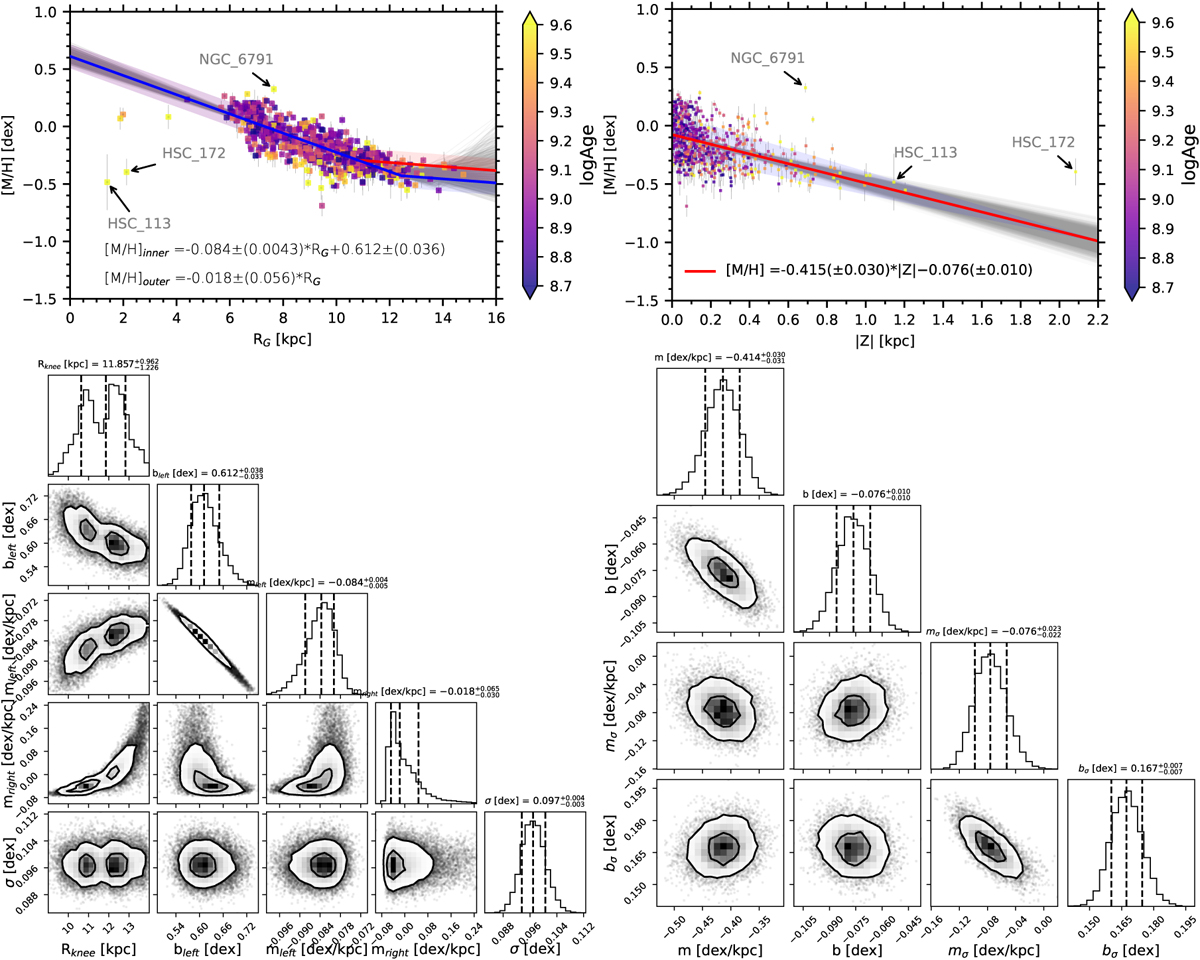
Top panels: radial (top left) and vertical (top right) metallicity distributions of our sample of 597 OCs, colour-coded by age. 1000 MC samplings (thin grey lines) in each panel are superimposed; the red and blue solid lines are the best fitting lines. The red or blue shaded bands in each panel corresponds to the 1σ dispersion around the gradient. The knee positions of red and blue breaks in the top left panel are 10.80±0.04 kpc and 12.43±0.04 kpc, respectively. The three outliers are indicated. Bottom panels: posterior distributions of the fit parameters of radial (bottom left) and vertical (bottom right) metallicity distributions.
Current usage metrics show cumulative count of Article Views (full-text article views including HTML views, PDF and ePub downloads, according to the available data) and Abstracts Views on Vision4Press platform.
Data correspond to usage on the plateform after 2015. The current usage metrics is available 48-96 hours after online publication and is updated daily on week days.
Initial download of the metrics may take a while.