Fig. 2.
Download original image
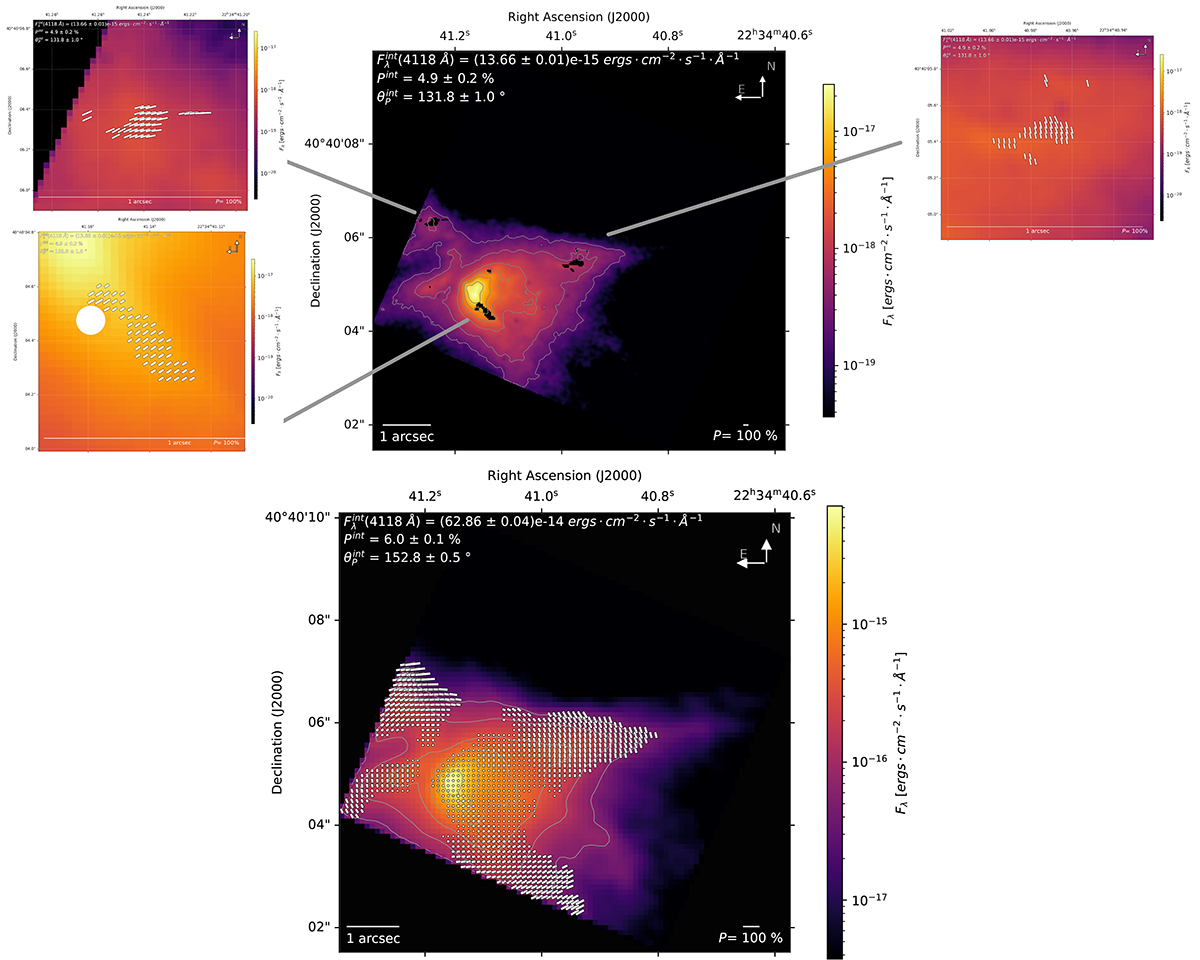
Same as Fig. 1 but for the 1994 post-COSTAR HST/FOC observation of LK-Hα-233. The top panel shows the high-resolution map, with inserts indicating where [S/N]P ≥ 3 polarization vectors are detected. The white dot corresponds to a reseau mark that was masked during the reduction process. The bottom panel shows the medium-resolution map. Due to slightly incorrect pointing, the source appears in the bottom-left corner of the FOC field of view and is partially cut off. The improved image sharpness resulting from the COSTAR corrective optics package is clearly visible.
Current usage metrics show cumulative count of Article Views (full-text article views including HTML views, PDF and ePub downloads, according to the available data) and Abstracts Views on Vision4Press platform.
Data correspond to usage on the plateform after 2015. The current usage metrics is available 48-96 hours after online publication and is updated daily on week days.
Initial download of the metrics may take a while.