Fig. 1.
Download original image
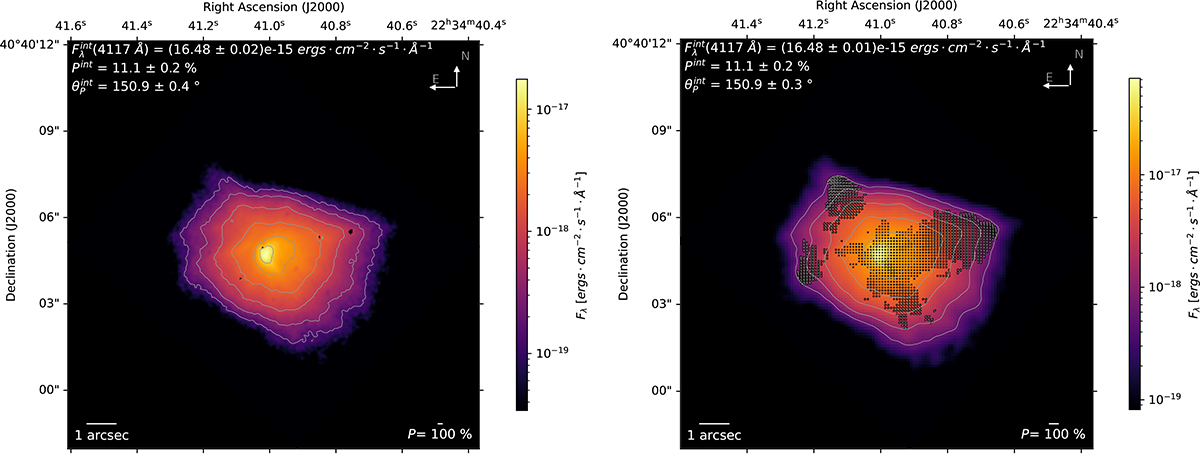
Left: 1991 pre-COSTAR HST/FOC observation of LK-Hα-233 resampled according to the Nyquist–Shannon sampling theorem (i.e., 2 × 2 pixels2 or 0.0287 × 0.0287 arcseconds2), to ensure individual pixels yield meaningfully polarization measurements. The total flux is color-coded and expressed in units of erg cm−2 s−1 Å−1. Polarization vectors are displayed for [S/N]P ≥ 3, although at this spatial resolution they are difficult to resolve visually (larger images are presented in the appendices). Total flux contours are displayed for 0.8%, 2%, 5%, 10%, 20%, and 50% of the maximum flux. In the top-left corner, we indicate the total flux F, polarization degree P, and polarization angle θ values, integrated over the whole field of view (7 × 7 arcseconds2 in this image). Following the IAU convention, north is up and the polarization angle positively rotates toward the east. Right: Same image but with a spatial binning of 0.1 arcsecond per pixel. The polarization pattern highlighted by the vectors becomes more apparent at this scale.
Current usage metrics show cumulative count of Article Views (full-text article views including HTML views, PDF and ePub downloads, according to the available data) and Abstracts Views on Vision4Press platform.
Data correspond to usage on the plateform after 2015. The current usage metrics is available 48-96 hours after online publication and is updated daily on week days.
Initial download of the metrics may take a while.