Open Access
Fig. 6
Download original image
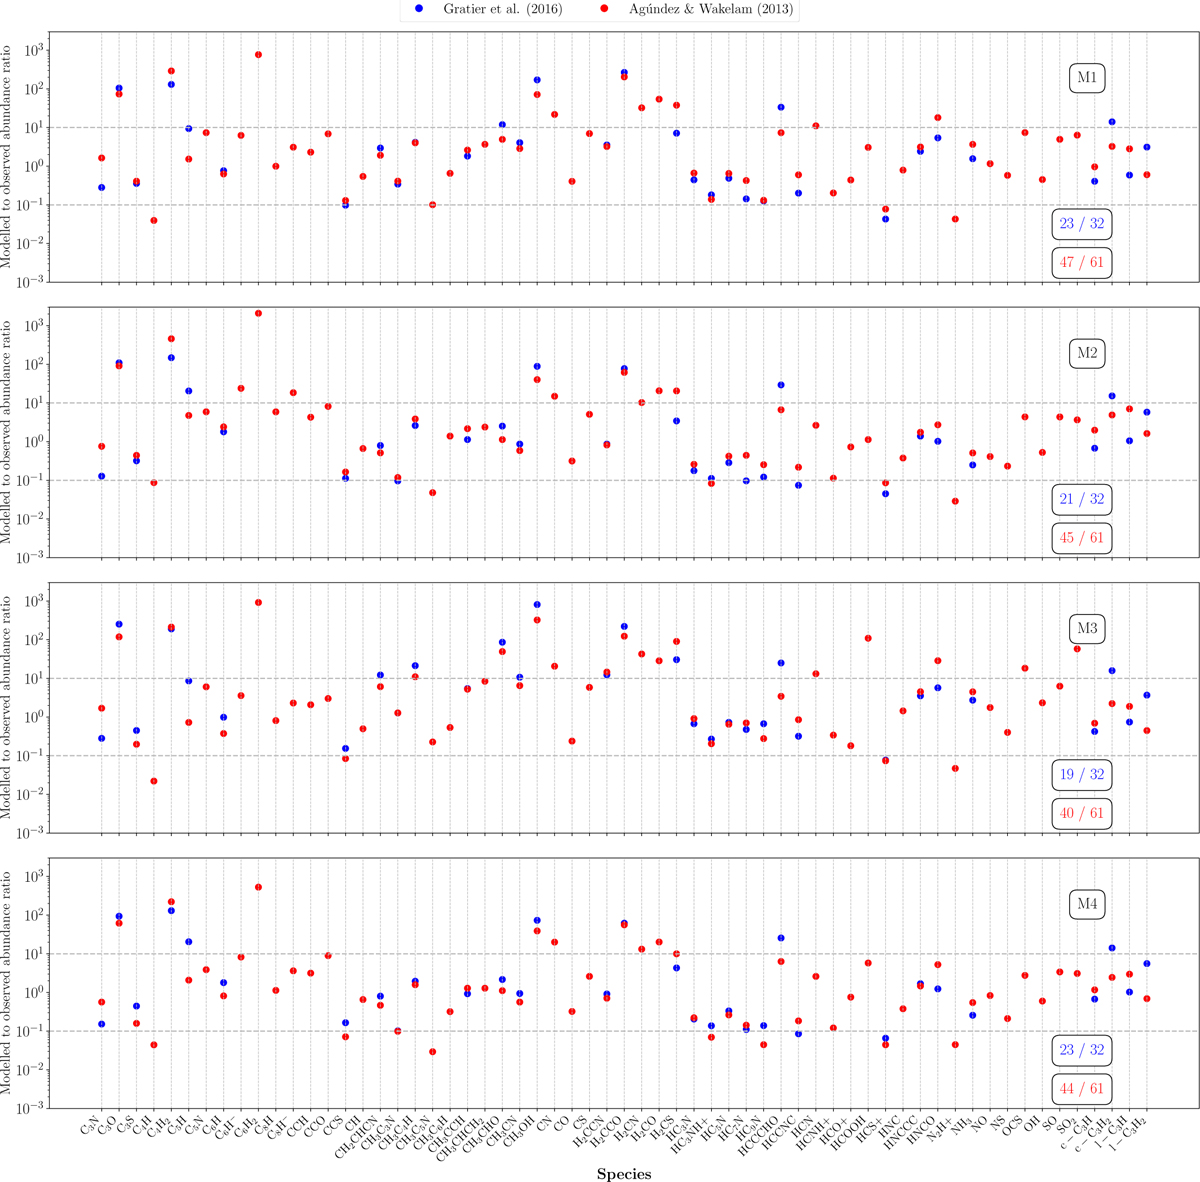
Ratios of modeled abundances to observed abundances for each model, for both datasets used in this work. Only species without upper or lower limits are shown. The number of species reproduced by each model is indicated for the datasets of Gratier et al. (2016) (blue) and Agúndez & Wakelam (2013) (red).
Current usage metrics show cumulative count of Article Views (full-text article views including HTML views, PDF and ePub downloads, according to the available data) and Abstracts Views on Vision4Press platform.
Data correspond to usage on the plateform after 2015. The current usage metrics is available 48-96 hours after online publication and is updated daily on week days.
Initial download of the metrics may take a while.