Open Access
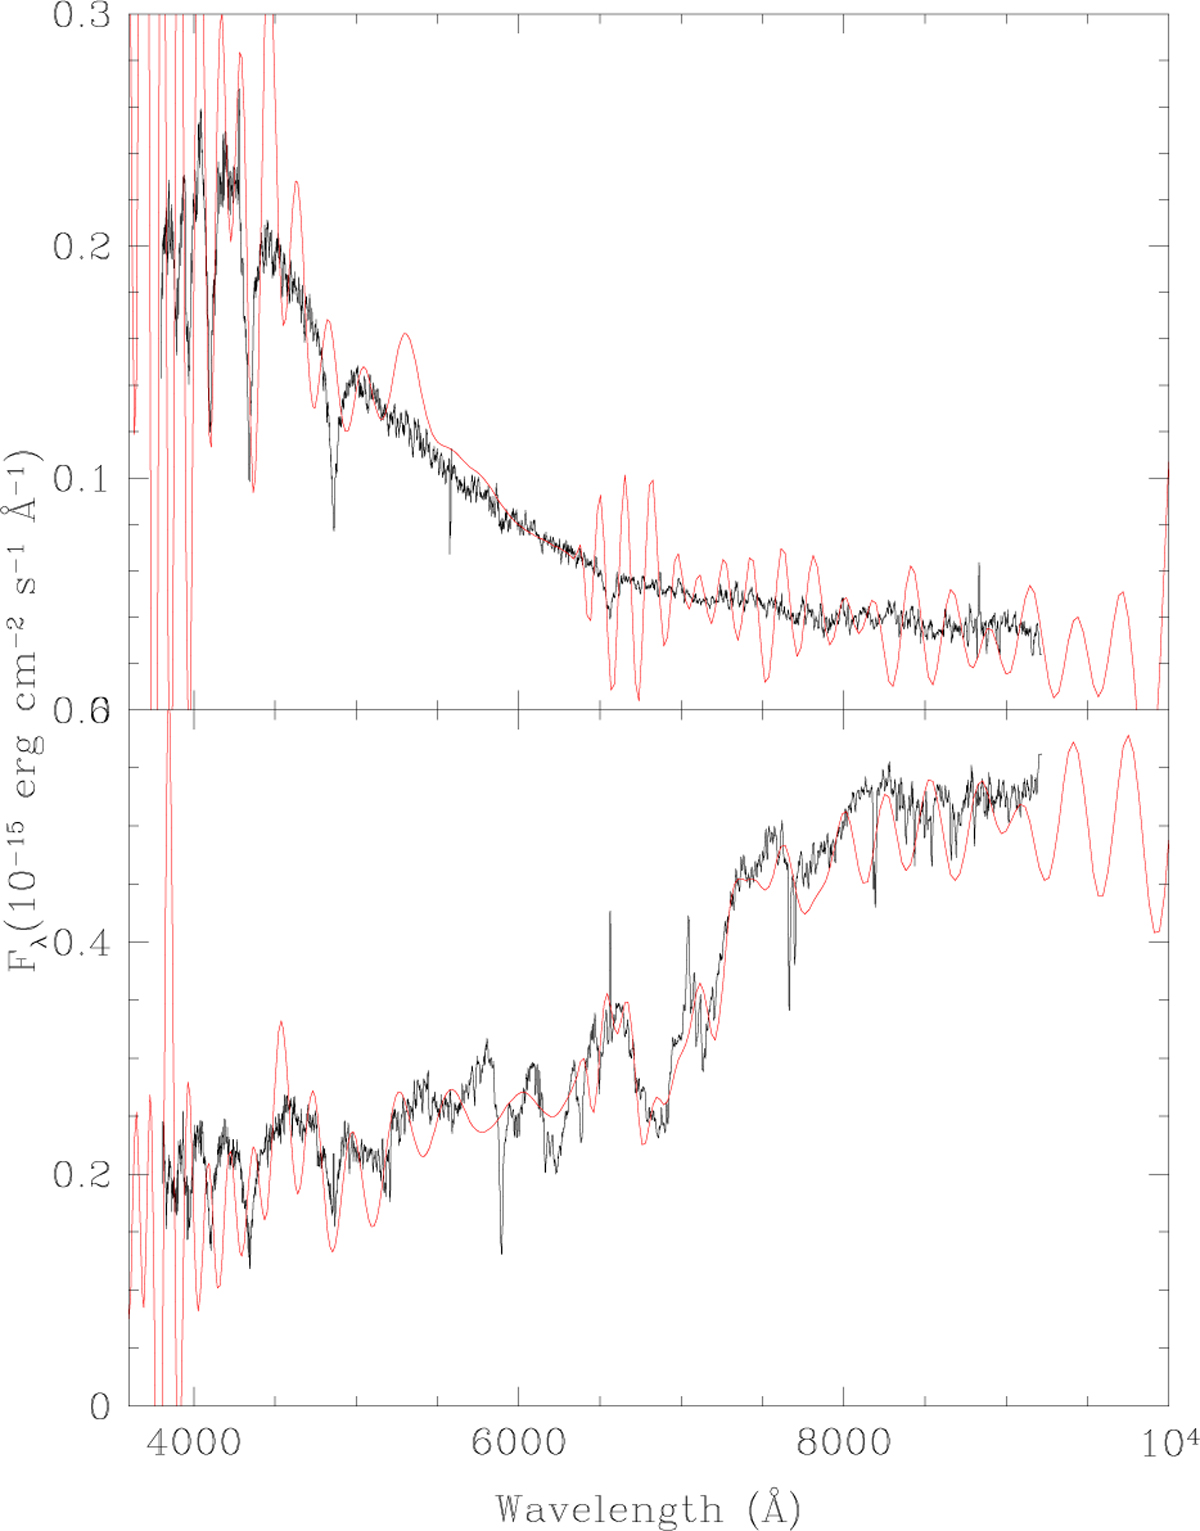
Fig. 9
Download original image
Example spectra of WDMS binaries displaying red (top; Gaia ID 904263926328520320) and blue (bottom; Gaia ID 686844023151243904) excess clearly visible in the SDSS spectra (black) but diluted in the Gaia spectra (red).
Current usage metrics show cumulative count of Article Views (full-text article views including HTML views, PDF and ePub downloads, according to the available data) and Abstracts Views on Vision4Press platform.
Data correspond to usage on the plateform after 2015. The current usage metrics is available 48-96 hours after online publication and is updated daily on week days.
Initial download of the metrics may take a while.