Fig. 7
Download original image
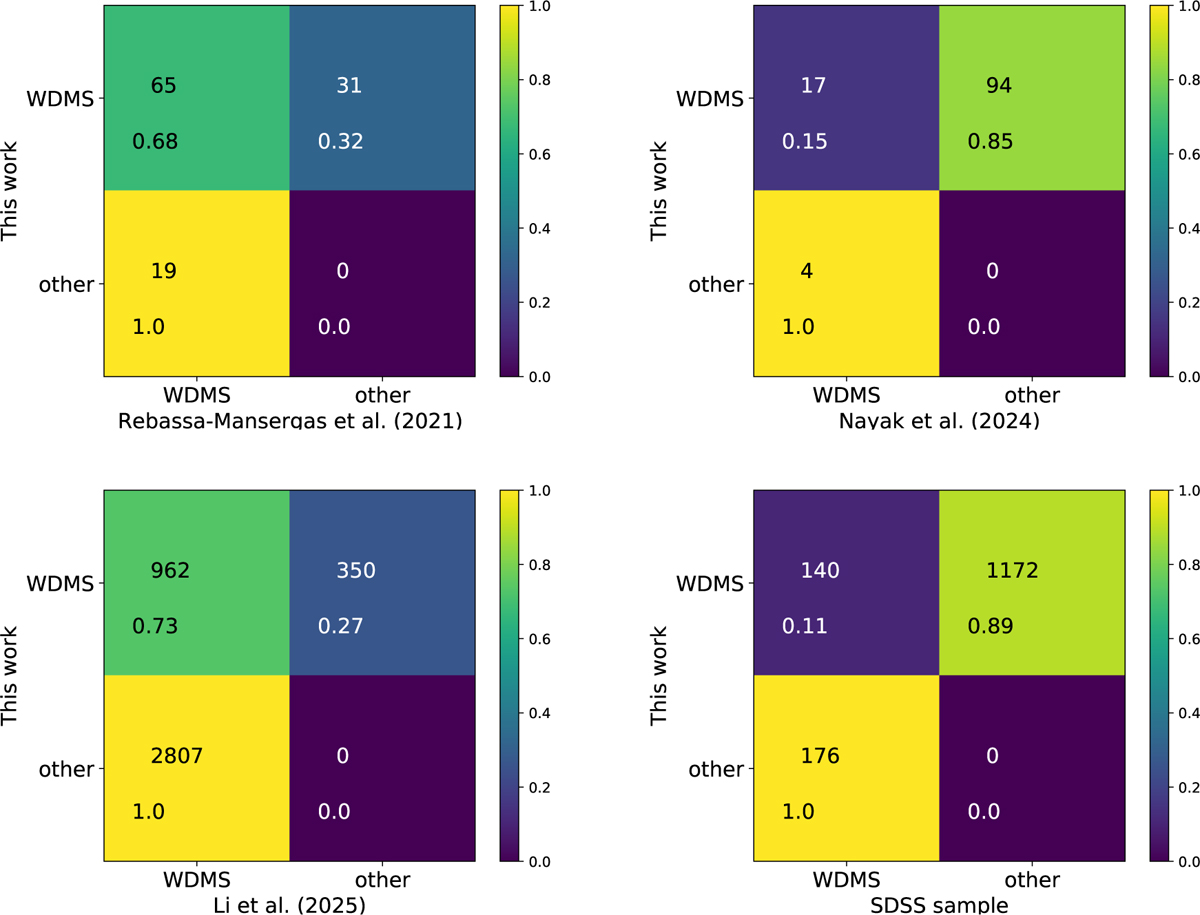
Confusion matrices representing the level of agreement between our catalogue and other samples: Rebassa-Mansergas et al. (2021b) at the top-left, Nayak et al. (2024) at the top-right, Li et al. (2025) at the bottom-left, and the SDSS WDMS sample at the bottom-right. The values within the matrices indicate the number of targets falling in each category and the percentages respect to the total number of objects in each row. In particular, the top-left cells in each matrix indicate the number and fraction of common objects, whilst the diagonal cells indicate the number of objects (and fractions) missed (or not included) by the corresponding works.
Current usage metrics show cumulative count of Article Views (full-text article views including HTML views, PDF and ePub downloads, according to the available data) and Abstracts Views on Vision4Press platform.
Data correspond to usage on the plateform after 2015. The current usage metrics is available 48-96 hours after online publication and is updated daily on week days.
Initial download of the metrics may take a while.