Fig. B.1
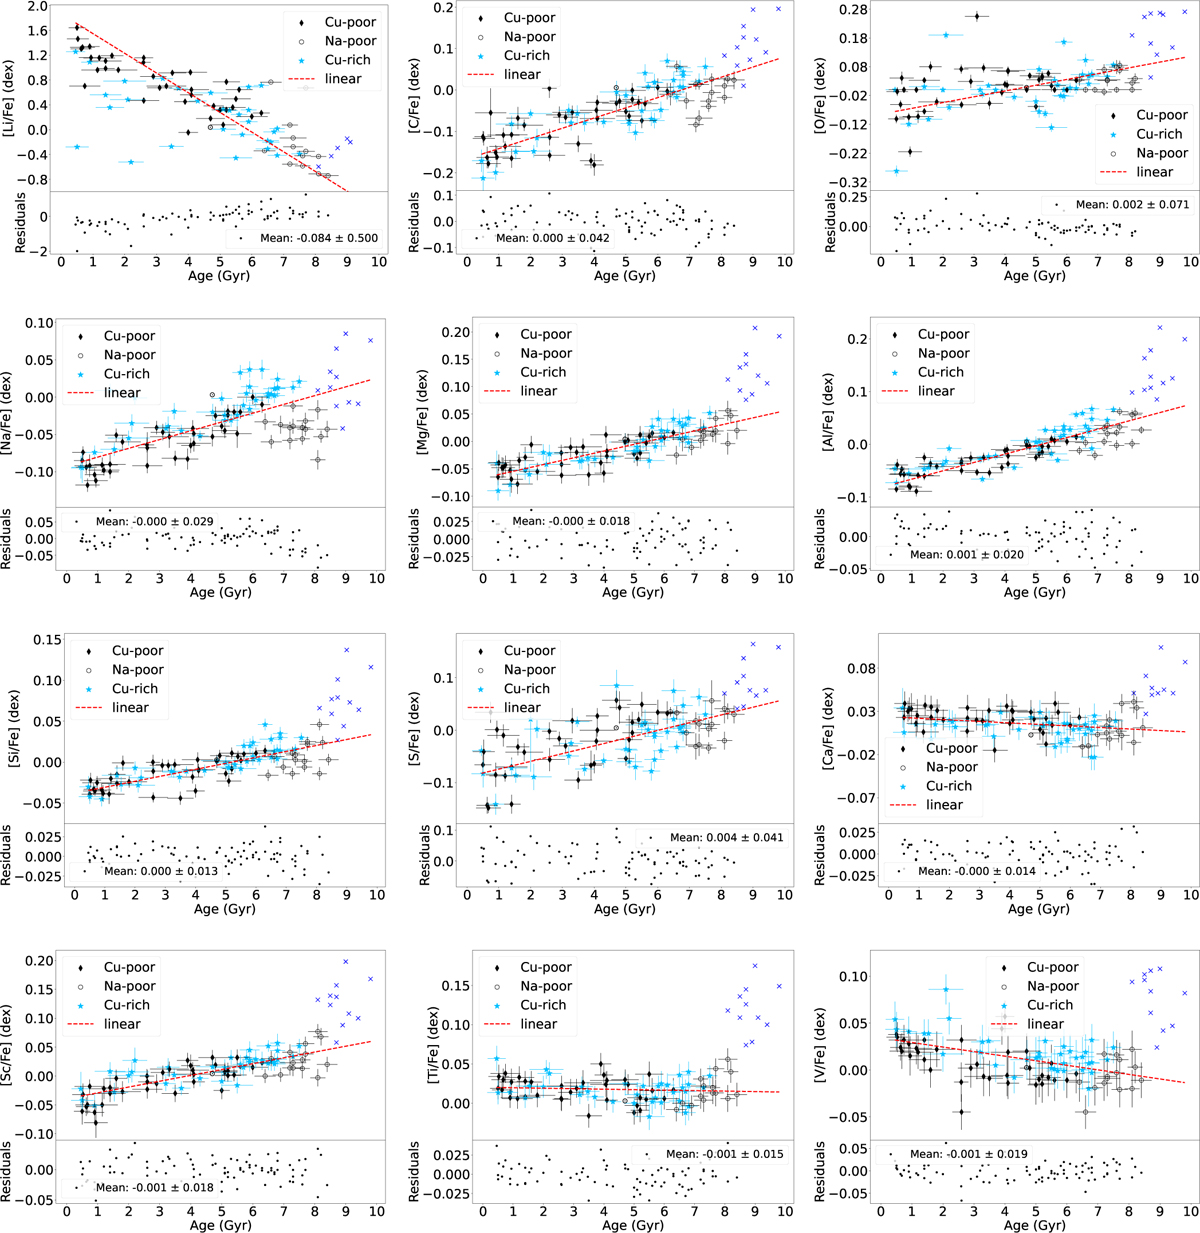
Download original image
Linear fit of the abundance ratios [X/Fe] versus age for all 20 elements. The stars represented by blue crosses are from the thick disk and were not considered in the linear fit (red dashed line). The black empty circles are stars from the distinct population identified in the [Na/Fe] plot, and the blue filled circles and black diamonds are stars from the Cu-rich and Cu-poor populations, respectively. The bottom panel shows the residuals, as well as their average and standard deviation.
Current usage metrics show cumulative count of Article Views (full-text article views including HTML views, PDF and ePub downloads, according to the available data) and Abstracts Views on Vision4Press platform.
Data correspond to usage on the plateform after 2015. The current usage metrics is available 48-96 hours after online publication and is updated daily on week days.
Initial download of the metrics may take a while.