Open Access
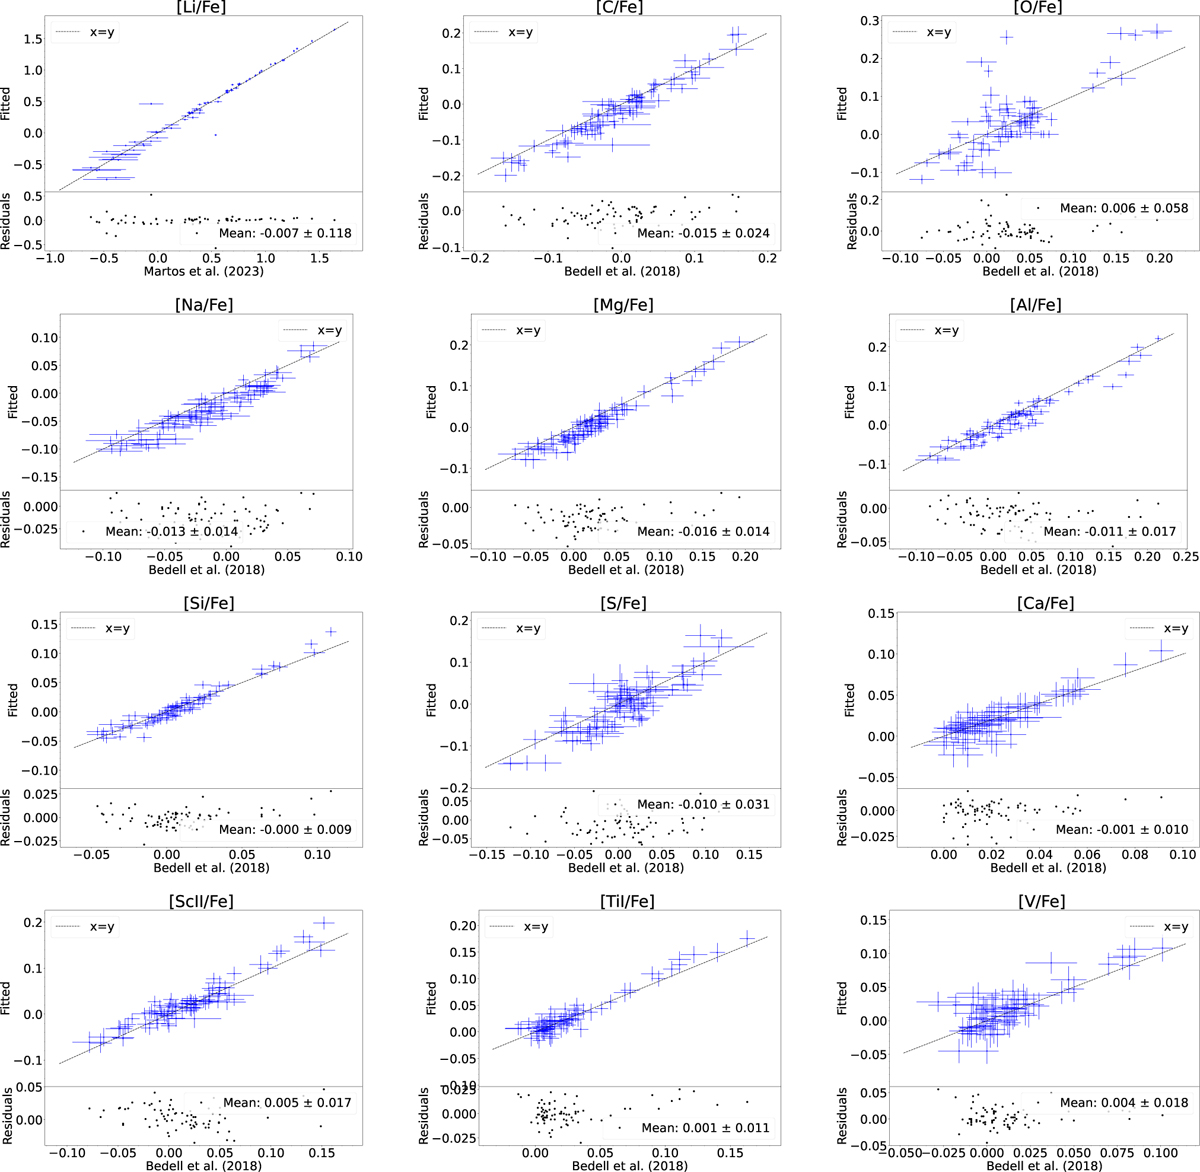
Fig. A.2
Download original image
Comparison of the abundances obtained automatically with Martos et al. (2023) for Li, Spina et al. (2018) for Y and Ba and Bedell et al. (2018) for the other elements. The bottom panel shows the residuals, as well as their average and standard deviation.
This figure is made of several images, please see below:
Current usage metrics show cumulative count of Article Views (full-text article views including HTML views, PDF and ePub downloads, according to the available data) and Abstracts Views on Vision4Press platform.
Data correspond to usage on the plateform after 2015. The current usage metrics is available 48-96 hours after online publication and is updated daily on week days.
Initial download of the metrics may take a while.