Fig. 9
Download original image
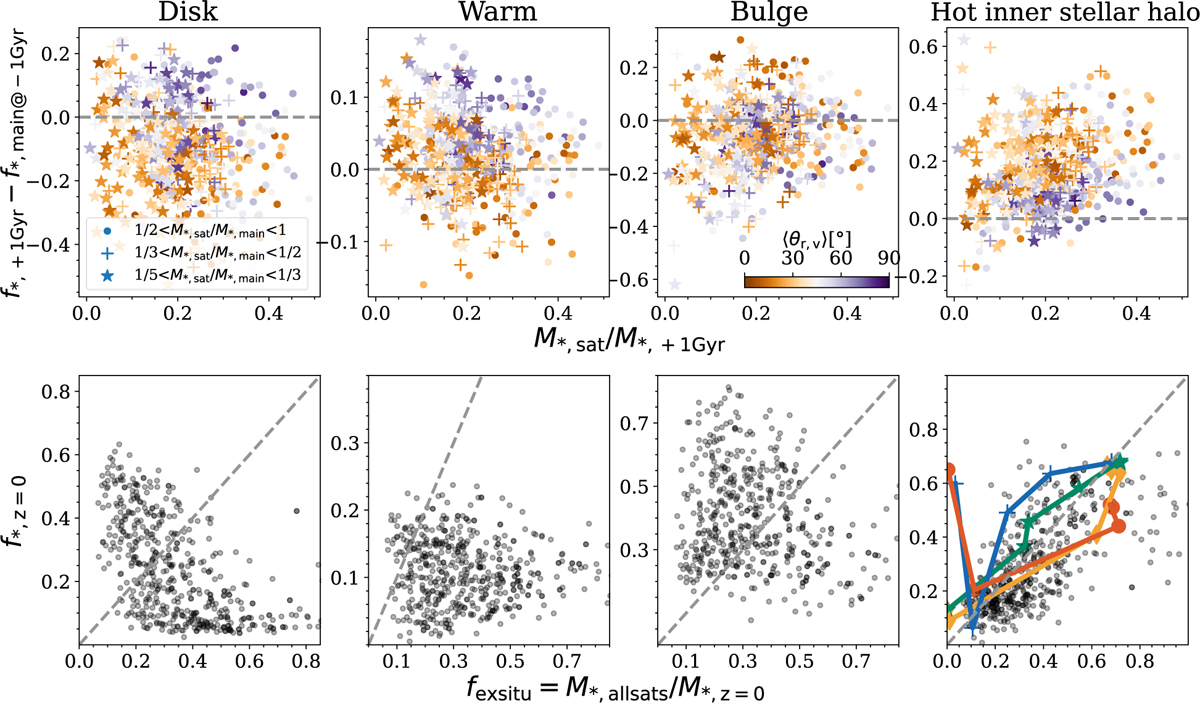
Top: change in the mass fractions of disk, warm, bulge, and hot inner stellar halo vs. M*, sat/M*,+1 Gyr for all the merger pairs. The colors of the top panels represent ⟨θr, v⟩. The circle, plus, and star symbols denote mass ratios of 1/2–2, 1/3–1/2, and 1/5–1/3, respectively. The gray dashed lines indicate no change in mass fractions. Bottom: mass fraction of different components in galaxies at z=0 vs. the total ex situ stellar mass fraction of the galaxy. The gray dashed lines represent a 1: 1 relationship. Since each galaxy may have experienced multiple mergers, we illustrate the change in fhalo after each merger with four galaxies, colored by blue, green, orange, and red. The adding-up of multiple mergers results in a good correlation between fhalo, z=0 and the total ex situ stellar mass.
Current usage metrics show cumulative count of Article Views (full-text article views including HTML views, PDF and ePub downloads, according to the available data) and Abstracts Views on Vision4Press platform.
Data correspond to usage on the plateform after 2015. The current usage metrics is available 48-96 hours after online publication and is updated daily on week days.
Initial download of the metrics may take a while.