Fig. 6
Download original image
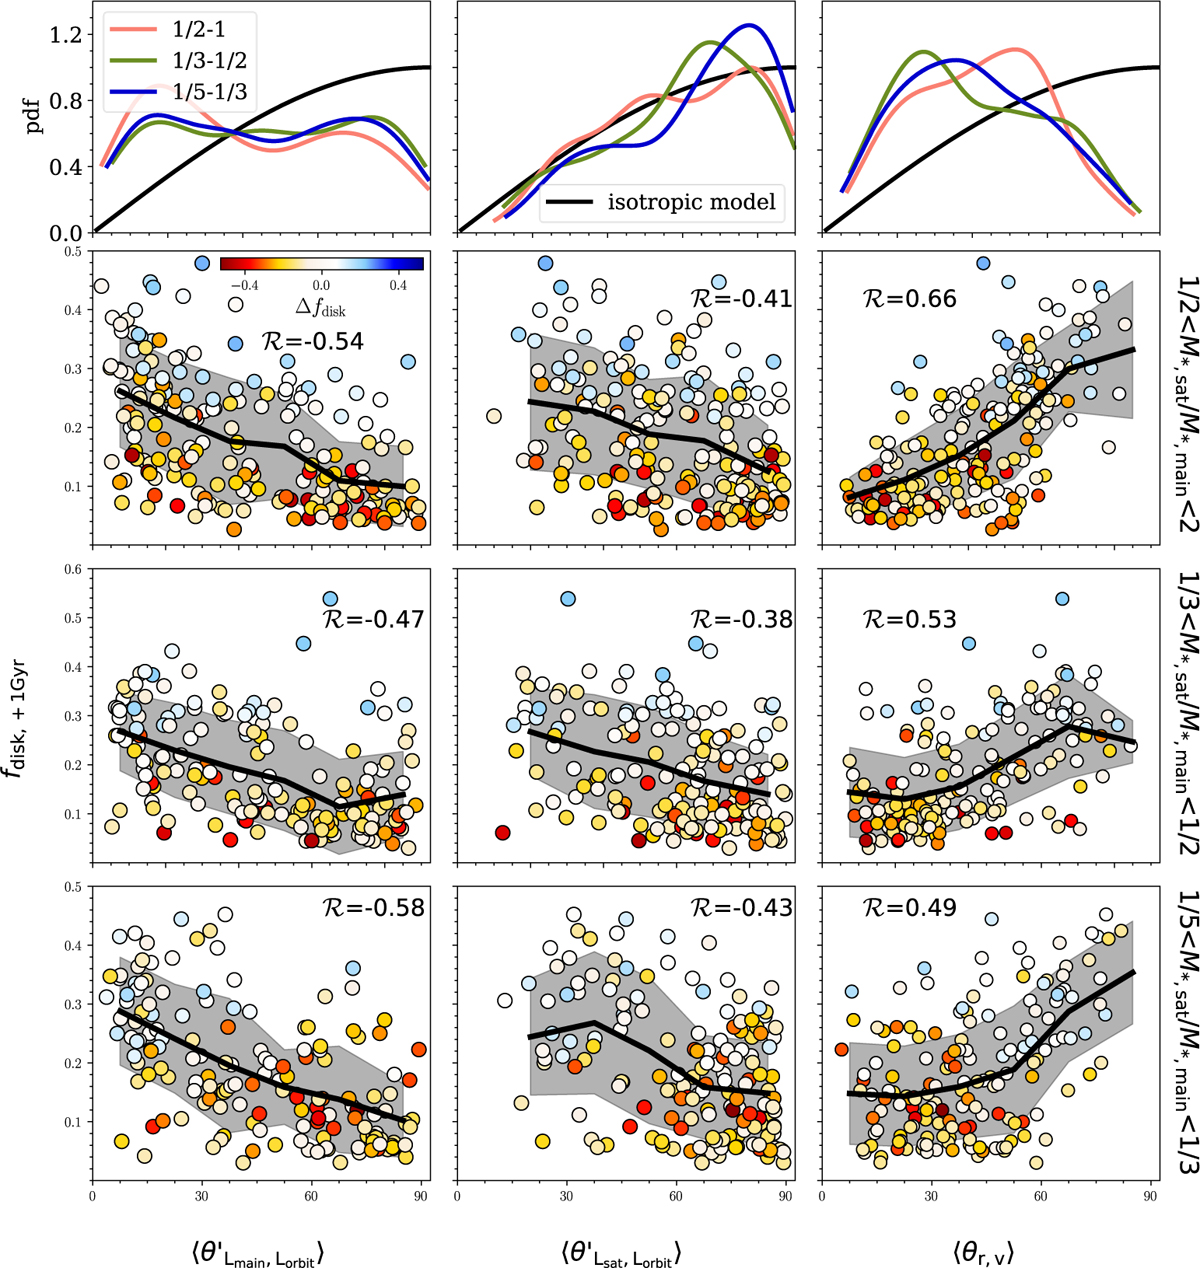
Disk fraction in the remnant galaxy at 1 Gyr after the merger as a function of the three angles. The columns from left to right are ![]() , and ⟨θr, v⟩. The rows from the second top to the bottom corresponds to mergers with mass ratio of 1/2–2, 1/3–1/2, and 1/5–1/3, respectively. Each dot represents one merger pair colored by Δfdisk, with red dots denoting a decrease in the disk fraction and blue dots denoting an increase in the disk fraction compared to the main progenitor galaxy at 1 Gyr before the merger. In each panel, the black solid line represents the running median of fdisk,+1 Gyr and the gray shadow regions indicate the ± 1σ scatter. The correlation coefficients between fdisk,+1 Gyr and angles are shown in each panel. The top row illustrates the probability density function (PDF) of the angles. The red, green, and blue lines represent mass ratio between 1/2 and 2, 1/3 and 1/2, 1/5, and 1/3, respectively, all smoothed using Gaussian kernel density estimation (KDE). The black line represents the PDF expected from an isotropic model.
, and ⟨θr, v⟩. The rows from the second top to the bottom corresponds to mergers with mass ratio of 1/2–2, 1/3–1/2, and 1/5–1/3, respectively. Each dot represents one merger pair colored by Δfdisk, with red dots denoting a decrease in the disk fraction and blue dots denoting an increase in the disk fraction compared to the main progenitor galaxy at 1 Gyr before the merger. In each panel, the black solid line represents the running median of fdisk,+1 Gyr and the gray shadow regions indicate the ± 1σ scatter. The correlation coefficients between fdisk,+1 Gyr and angles are shown in each panel. The top row illustrates the probability density function (PDF) of the angles. The red, green, and blue lines represent mass ratio between 1/2 and 2, 1/3 and 1/2, 1/5, and 1/3, respectively, all smoothed using Gaussian kernel density estimation (KDE). The black line represents the PDF expected from an isotropic model.
Current usage metrics show cumulative count of Article Views (full-text article views including HTML views, PDF and ePub downloads, according to the available data) and Abstracts Views on Vision4Press platform.
Data correspond to usage on the plateform after 2015. The current usage metrics is available 48-96 hours after online publication and is updated daily on week days.
Initial download of the metrics may take a while.